US Stocks Hit New All-Time High, Why Isn't the Market Worried About Geopolitical Tensions?
On April 15th, the S&P 500 closed at 7,022.95 points, a full 77 days since its last all-time high. During these 77 days, the United States engaged in a war, oil prices surged past $100, and the stock market experienced its fastest 10% correction in five years. Yet, it still managed to return to a new high in approximately 11 trading days.
This number is worth reflecting on. In American history, after every crisis of a similar scale, such speed was deemed impossible.
What Does 11 Trading Days Mean Historically
Where does the speed of this recovery stand on the historical timeline?
According to PBS, J.P. Morgan strategists referred to this recovery as the "fastest rebound since the onset of the COVID-19 pandemic." When comparing historical data, this statement is not an exaggeration.
During the COVID-19 pandemic in 2020, it took about 103 trading days for the market to return to its previous high from the low point on March 23rd to August 18th. The Gulf War of 1990 saw around 87 trading days from the low point at the end of October to reclaiming the previous high in February 1991. The U.S. debt crisis of 2011 took about 106 trading days from the low point in October of that year to reach a new high in March 2012.
The recovery from the Iran war of 2026: 11 trading days.

It is important to note that the magnitude of this correction (approximately 10%) is much smaller than during the COVID-19 period (about 34%) and in 2011 (about 19%). Even compared to the similar magnitude drop during the Russia-Ukraine conflict of 2022, that recovery took around 18 trading days. Eleven days still remain an outlier.
The narrative of this correction has always been about "ceasefire expectations" rather than "deteriorating economic fundamentals." The market fell due to uncertainty, not profits. When the ceasefire news actually arrived, uncertainty pricing was quickly erased, without needing to wait for earnings reports to rebuild confidence.
The Word "Ceasefire" Led to Market Rallying Twice
To grasp the speed of this recovery, one must first understand the news context.
On February 28th, the United States and Israel launched a military strike against Iran. The S&P 500 started declining from its previous high of 7,002 points on January 28th and hit a low of 6,316 points on March 30th, marking a nearly 10% drop. By Wall Street's definition, this conveniently fell on the cusp of a "correction."
However, during this downward process, a strange thing happened. On March 24, rumors of the "Hormuz Strait possibly reopening" spread in the market, and the S&P rebounded that day. This was the first "ceasefire pricing." The rumors were later debunked, and the market continued to fall.
On April 8, Trump announced a two-week temporary ceasefire on social media, and the Iranian side also accepted Pakistan's mediation proposal. The S&P 500 surged 2.5% in a single day. This was the second "ceasefire pricing," at a higher price, with almost the same rationale.

From Chart 1, we can see that the event annotations corresponding to the two sharp rises are symmetrical, both indicating an "increased ceasefire possibility." It rose the first time, then rose again the second time. However, as of the historical high set on April 15, the two-week temporary ceasefire agreement has not expired, and not a single word has been signed for a permanent peace agreement.
What is the market pricing in for? Not "the end of the war," but "the possibility of the war ending." This expectation has been priced in twice.
Fear Index Lower Than Before the War
A more counterintuitive figure is the VIX, which is the index Wall Street uses to measure market panic levels.
When the war broke out on February 28, the VIX jumped from around 16 to hit 35.3 on March 9. This makes sense: war is a risk, and the market needs to price in uncertainty.

But what followed was against conventional wisdom. Starting from March 9, despite the ongoing war, rising oil prices, and the Senate voting on whether to authorize war powers, the VIX steadily declined. By April 15, the day the S&P hit a historic high, the VIX closed at around 18.4, lower than the pre-war level on February 28.
What does this mean? It means the market has reclassified this war from a "source of uncertainty" to a "calculable risk." Within six weeks, an ongoing war transformed from a "panic event" to a "quarterly commodity."
What enabled this shift is a very specific financial mechanism. According to CNBC, JPMorgan's Q1 2026 trading desk revenue reached $11.6 billion, setting a record, a 20% year-on-year increase. The fixed income division accounted for $7.1 billion in revenue, mainly being driven by commodity, currency, and emerging market trades, precisely the areas where the Iran war generated the most "volatility."
In other words, when retail investors are feeling fear, institutional players are collecting volatility as profit. The smoother this mechanism operates, the more the market tends to "digest" the war, and the faster the VIX drops.
The Commercialization of Volatility
On April 15, the same day the S&P 500 hit a new all-time high, the Pentagon announced a deployment of 10,000 troops to the Middle East, and the Senate rejected the war powers authorization for the fourth time. These two events happened on the same day, and the market had no reaction to them.

As seen in Chart 4, JPMorgan's trading revenue pillar for Q1 2026 is much higher than the previous eight quarters. This is not a marginal improvement but a surge.
Supporting this surge is the money earned by hedge funds and market makers in war volatility. According to Goldman Sachs Prime Brokerage data, as of April 14, U.S. hedge funds' net long positions have turned positive for the first time since the end of 2025. At the same time, based on FINRA data cited by Atwater Malick, U.S. stock financing margin balance has hit a record high of $1.28 trillion, a 36% year-over-year increase.
Three signals appearing simultaneously – hedge funds going from short to long, record leveraged funds, and the market hitting an all-time high – represent the standard "buy the optimism" pattern.
Understanding this pattern requires looking at the financial infrastructure layer. When Wall Street's market makers, derivatives markets, and hedge funds are mature enough, geopolitical shocks are no longer exogenous unpredictable risks but raw materials that can be priced, hedged, and commercialized. The Iran war is not a threat to JPMorgan's trading desk but an opportunity. The same goes for hedge funds that have positioned themselves correctly.
This is the true meaning of "two screens, two worlds" on April 15. While the Pentagon prolongs the war, the market is pricing in the end of the conflict. These two events are not contradictory because for market makers, how long the war lasts is irrelevant; what matters is whether the volatility is sufficient.
Of course, this mechanism has its vulnerabilities. Behind the 11 trading days of reaching new highs lies an assumption: that a two-week ceasefire will be smoothly renewed, Iran nuclear negotiations will progress as expected, and oil prices will fall. If any of these assumptions goes wrong, there is not much cushion in the current pricing. The $1.28 trillion leveraged funds are also amplifiers in a declining market.
7,000 points is a price that only holds in the most optimistic scenario.
Recommended
Desk: Brent Crude Tops $110, Musk's Net Worth Drops 528.6 Billion in Four Days After Tesla Roadster Launch
Oct 17, 21:49
JST Fifth Buyback and Burn Successfully Concludes: Over 170 Million Tokens Worth Approximately $23.53 Million Burned, Buyback Mechanism Set for Comprehensive Upgrade
Oct 17, 20:10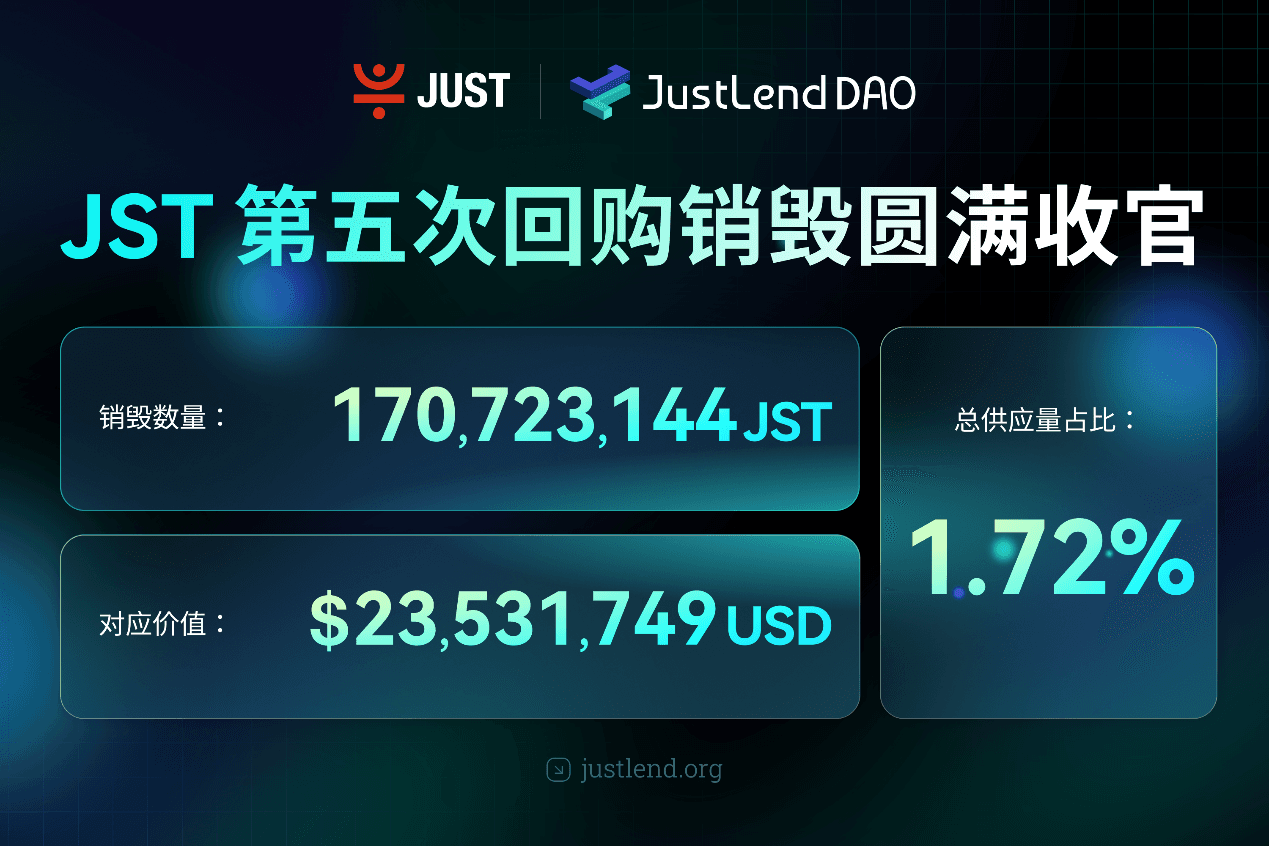
BitTorrent Brand Upgrade and Initial BTT Buyback & Burn Launch Simultaneously, Dual Engines Usher in New Era of Web3 Infrastructure
Oct 17, 20:00
Asia Market Daily: Japan's BOJ signals more rate hikes while Korea targets offshore perpetual platforms (2026/10/17)
Oct 17, 17:01Why did Papertrade backfire on you?
Oct 17, 17:01
The 'Strict Father' of Northern Myanmar: This Company Deploys 200,000 "AI Best Actors" to Strike Back Against Scammers
Oct 17, 15:34