Home Bias: Predicting Country Deviation in the Market

Prediction market prices are often interpreted as a consensus estimate of the event's probability by the crowd, with its effectiveness implicitly relying on the neutrality of the participants. This article uses the full transaction data of the 2026 FIFA World Cup winner markets on two platforms, Polymarket and Kalshi — 2.85 million Yes-direction trades, $148.7 million nominal value, 129,175 unique wallets on Polymarket, and 814 million Yes contracts, $34.7 million nominal value on Kalshi — to examine whether the distribution of betting funds at the national level aligns with the teams' market-implied strengths.
The study identifies two classes of mutually independent systematic biases. Firstly, the Home Team Bias: on Kalshi, open only to KYC-completed U.S. users, the Yes funds for the U.S. and Mexico reach 6.1 times and 5.2 times their pre-match win probability shares, respectively, while Switzerland, Uruguay, and Turkey, with identical pre-match odds, are only at 0.1-0.3 times; similarly, these two teams are only over-allocated by 2.0-2.8 times on Polymarket, a platform open globally — the bias magnitude is positively correlated with the platform's accessibility to the country's population. Secondly, the Underdog Bias: across both platforms, teams with less than a 0.5% win probability are generally over-allocated by 4-16 times based on the number of individual buyers, while popular teams are under-allocated based on headcount.
These biases further propagate to pricing: as of July 5, the U.S. and Mexico exhibit a 18% and 40% sustained premium on Kalshi relative to Polymarket, while the cross-platform price differences for all non-home teams are within ±3%. The results indicate that when demand from a specific country is concentrated on a single platform and cross-platform arbitrage is incomplete, the platform's "consensus probability" incorporates a measurable national component.
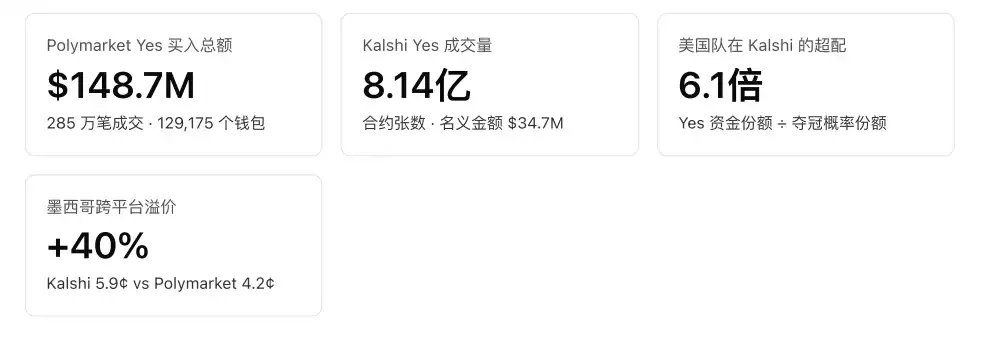
The core proposition of prediction markets is that prices aggregate dispersed private information, making them an unbiased estimate of event probability. One of the premises for this proposition to hold is that participant entry is not systematically filtered by factors unrelated to the event itself. Sports events provide a clean test scenario — the World Cup winner market has three rare conditions: a fully enumerated outcome space (48 teams), each outcome naturally tied to a country, and vastly different access rules for the two main platforms. Kalshi, regulated by the CFTC, is only open to KYC-completed U.S. residents; Polymarket settles on a public blockchain and is globally accessible.
This leads to the formulation of two testable hypotheses:
· H1 (Funding Flow Hypothesis): If the platform users' national composition influences betting behavior, then a national team's share of funds raised on a platform where the "accessible population" is from their own country should be systematically higher than their strength-based share, and this over-allocation should be stronger on platforms with restricted access.
· H2 (Pricing Hypothesis): If H1 holds true and cross-platform arbitrage is incomplete, then a national team on a platform where demand is concentrated should experience sustained positive price divergence.
This study directly tests H1 and H2 using full transaction data from two platforms. In contrast to survey-based or sample-based behavioral studies, on-chain and exchange transaction records cover every real bet placed, eliminating sampling errors and self-report biases.
2.1 Market and Sample
The analysis focuses on the flagship championship markets of two platforms, covering all 48 participating teams:
· Polymarket event world-cup-winner: A binary market for all 48 teams ("Will X win the 2026 FIFA World Cup?") settled on the Polygon chain through the CTF Exchange, with all transactions recorded on-chain for verification.
· Kalshi event KXMENWORLDCUP-26: Each team has a contract (e.g., KXMENWORLDCUP-26-US) regulated by the CFTC.
The sample includes every transaction from market inception (May 2025) to July 5, 2026, with zero sampling. Kalshi's trade records were deduplicated based on trade_id from the original trade logs; only the 48 teams that advanced to the main tournament were retained on the Kalshi side. Contracts for teams that did not qualify (such as Italy, Denmark, etc.) during the qualifying period were excluded as there were no corresponding markets on Polymarket to ensure cross-platform comparability.
2.2 Measurement Metric: Directional Yes Buy Flow
Total transaction volume at the market level is not suitable for addressing national bias issues. Championship markets follow a neg-risk structure, where market makers and arbitrage bots continuously rebalance inventory across the 48 outcomes, leading to converging turnover for all teams, decoupled from actual attention (Table 1). To strip away this neutral turnover, all metrics in this study only consider directional Yes buys—betting behavior on a national team that manifests as buying the Yes position for that team:
· Polymarket: In the CTF Exchange's matching record, with Asset ID 0 USDC collateral, the party that paid USDC, i.e., the buyer: buyer = if(maker_asset_id='0', maker_address, taker_address). All 3.85 million World Cup trades can be unambiguously categorized based on this.
· Kalshi: Taking trades with taker_side='yes' (those who actively bought Yes), the nominal amount = contract quantity × Yes price.
Table 1 · A Comparison of Surface Trading Volume and Directional Yes Buy Flows (Polymarket, excerpt)
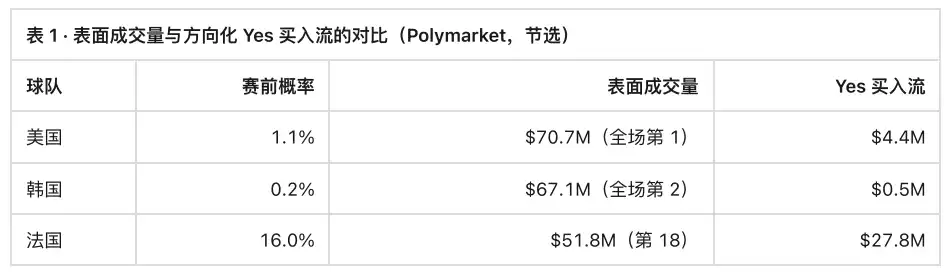
Post-directionalization, the distribution of fund flows has reverted to correlation with team strength (France leading with $27.8M, 34,331 unique buyers), with the remaining deviations being the objects of explanation.
In addition, three parallel reporting metrics: Yes USD (sensitive to large funds), Yes contract quantity (Kalshi), and the number of unique Yes buyer wallets (Polymarket, sensitive to the number of participants). For sub-cent price trades below 1 cent, the contract quantity amplifies the weight of the low-price buying side. Therefore, all conclusions related to fund size will use the nominal amount, and the contract quantity metric will only be used to describe participation intensity.
2.3 Strength Benchmark
Use the pre-match market-implied championship probability as the benchmark for team strength: Take the Polymarket closing price of Yes for each team on the day before the start of the match (June 10, 2026), when the squad list was already finalized, and no match results had influenced the price. The advantage of this benchmark is that it represents the market's own assessment of strength. Therefore, any deviation of fund flow relative to this benchmark constitutes a deviation according to the market's own standards—without the need for external and lagging indicators such as FIFA rankings.
2.4 Imbalance Indicator
Overweight Ratio = The team's share of all Yes fund flows ÷ The team's share of the total championship probability.
A value of 1.0 indicates that the betting is perfectly proportional to the probability; greater than 1 indicates that the fund inflow exceeds the corresponding strength level. This indicator is naturally normalized to the platform scale and allows for direct cross-platform comparisons.
3.1 Cross-National Comparison within Same Odds Group: Direct Test of H1
The cleanest test of H1 is to conduct an intra-group comparison based on odds. There are five teams with pre-tournament winning probabilities in the 1-1.3% range: among them, the United States and Mexico are the hosts, allowing their nationals (including Mexican-Americans) to directly trade on Kalshi; Switzerland, Uruguay, and Turkey lack a retail U.S. base. Figure 1 shows a within-group gap of an order of magnitude:
Figure 1 · Super Allocation Factor of Five Teams in the Same Odds Range. Five teams with pre-tournament probabilities in the 1-1.3% range, calculated as Yes dollar volume ÷ Win probability volume. 1x = proportional to probability.
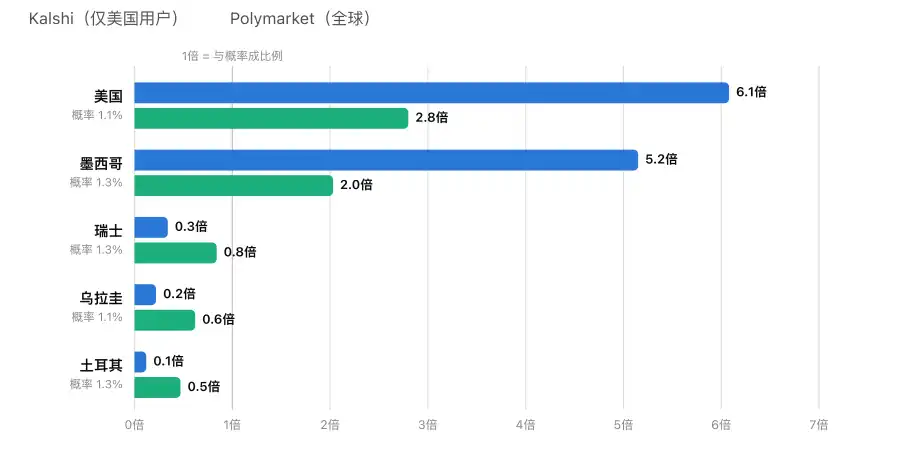
On the restricted-access Kalshi, the United States (6.1x) and Mexico (5.2x) received Yes dollars at 20-60 times that of the same-odds control group (0.1-0.3x).
In absolute terms: the U.S. team received $2.24 million, Mexico $2.25 million in Yes buys on Kalshi, while Switzerland, Uruguay, and Turkey, assessed by the market to have an equivalent winning probability, only received $150k, $80k, and $50k respectively. In terms of contract count, the two hosts are not only over-allocated but also ranked first and second out of all 48 teams (Figure 2) — Mexico with 65.9 million contracts, the U.S. with 60.6 million contracts, surpassing favorites like France (16%) and Spain (16.5%); the average trading price of U.S. contracts is only 3.7 cents, showing a typical structure of small amounts, low prices, and high frequency of participation for the home team.
Figure 2 · Cumulative Yes Contract Counts for Each Team on Kalshi (Top 12). ★ = Host Country. The pre-tournament winning probability is indicated on the right side of each bar.
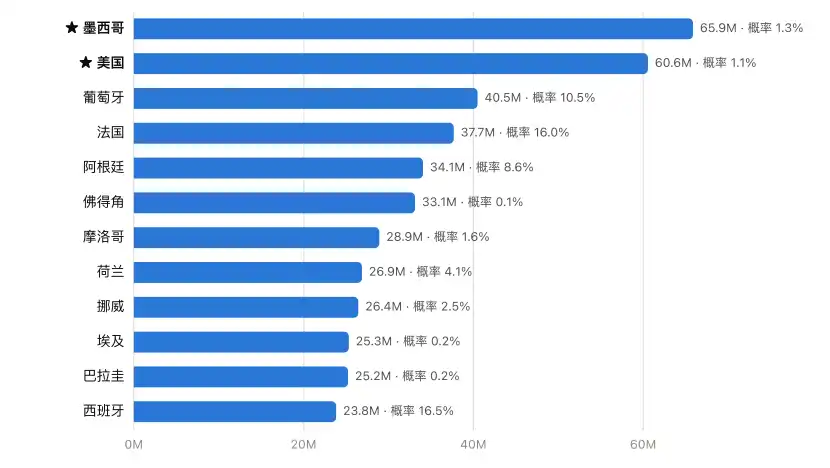
The two hosts lead all tournament favorites in participation intensity — the composition of the betting crowd is determined by platform access rather than team strength.
3.2 Cross-Platform Comparison: Deviation Magnitude Decreases with Access Contraction
Polymarket is globally open, and no single country can dominate its user base as U.S. users dominate Kalshi. If the mechanism of H1 is platform penetration, then the over-allocation of the same two teams on Polymarket should be significantly weaker than on Kalshi — the data supports this: the U.S. at 2.8x, Mexico at 2.0x, less than half of Kalshi's values. Figure 3 provides a full-sample perspective: Kalshi's dollar volume deviates significantly from the ratio line, while Polymarket closely follows the ratio line distribution.
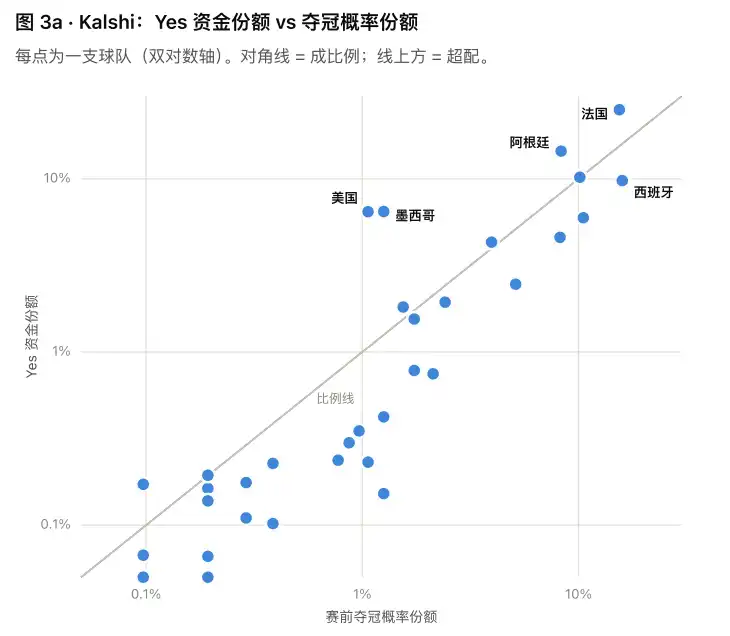
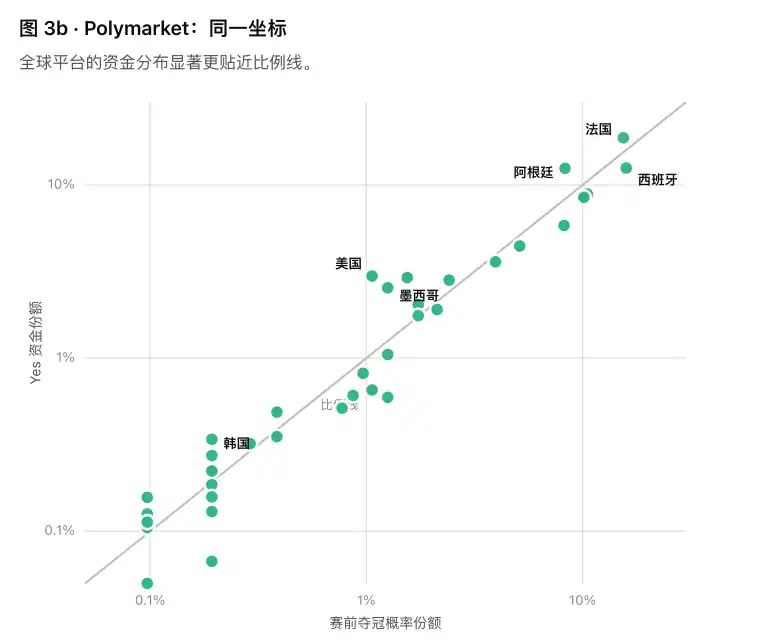
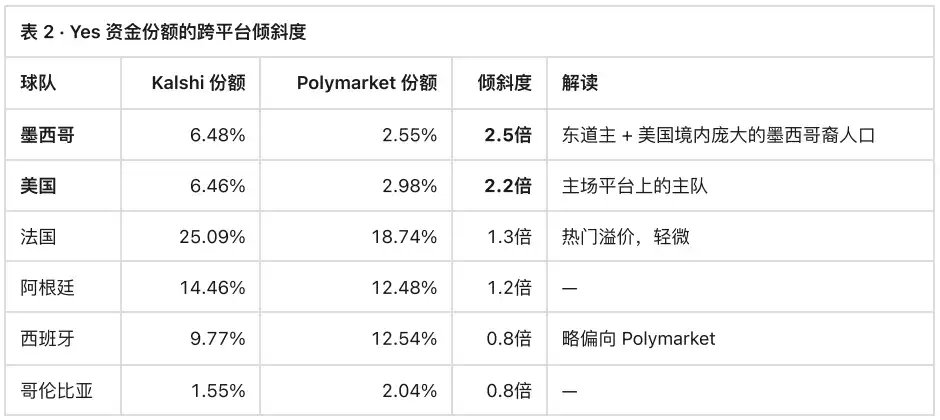
The most direct evidence of the penetration mechanism is each team's Kalshi share ÷ Polymarket share (Table 2): this ratio measures a country's relative concentration of funds on the U.S. platform, unrelated to team strength. Only the U.S. and Mexico teams in the entire sample significantly deviate from 1:
3.3 Dimension of Participation: Platform Community Structure
National bias on Polymarket is more reflected in the number of participants rather than in dollars. In regions with high crypto penetration, the number of unique wallet holders buying Yes for their national team far exceeds their probability share: South Korea is the most typical example—a team with a 0.2% probability of winning attracted 6,369 unique buyer wallets, 8.7 times their probability share (reaching 1.8 times in USD terms); on Kalshi, South Korea's contract volume is similarly overallocated by 9.8 times. Egypt (10.4 times), Ghana (16 times), Morocco (both USD and per capita 1.9 times) exhibit a similar pattern, consistent with the distribution of diaspora and crypto communities. In contrast, traditional powerhouses like Spain and England are only 0.4 times in terms of headcount. Where participants come from is determined by the platform's demographic structure.
3.4 Underdog Bias: The Second Force Orthogonal to National Bias
After removing the national factor, there is still a more general pattern in the data: all low-probability teams attract an excess of small buyers.
Teams on Polymarket with probabilities below 0.5% are almost all overallocated in terms of unique wallet holders by 4-16 times (Canada 6.6, Scotland 7.0, New Zealand 10.5, Czech Republic 11.6, Bosnia and Herzegovina 13.0); popular teams are underallocated per capita (Spain 0.43, England 0.40), but funds are concentrated on them—combining the French and Argentine teams accounts for 39.5% of the nominal amount of Yes on Kalshi, slightly higher than the sum of their probability shares.
The superposition of these two forces can thus be clearly decomposed: the crowd buys small "lottery tickets" for low-probability outcomes, while large funds concentrate on popular outcomes; and under the same odds, the national team receives an additional multiplier of 5-10 times on a platform accessible to its population. Intragroup comparison (Section 3.1) is precisely the design to separate "preference for underdogs" from "preference for underdogs of one's own country."
3.5 Pricing Implications: Test of H2
If a country's Yes demand is concentrated on a single platform and arbitrage is incomplete, the price on that platform should exhibit a positive deviation. Figure 4 compares all 16 surviving teams on the same day (July 5th) across platforms:
Figure 4: Latest Same-Team Transaction Yes Prices across Two Platforms (July 5, 2026). 16 teams in the knockout stage, aligned on the same day; teams with a price difference ≥7% are noted.
Price Discrepancies: Portugal Kalshi +12%; Mexico Kalshi +40%; USA Kalshi +18%.
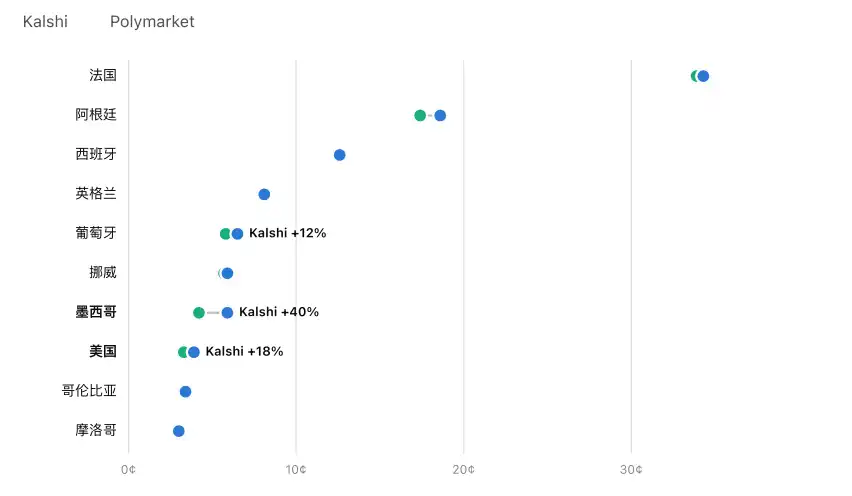
For non-native teams (France, Spain, England, Norway, Colombia, Morocco), cross-platform price deviations are within ±3%; Mexico +40%, USA +18%—the premiums happen to fall on the two teams with the most severe overallocation of funds.
The cross-sectional distribution of price deviations aligns with the H2 prediction: arbitrage operates effectively on non-native teams (within ±3% deviation), while on the two contracts with the most concentrated domestic demand, a sustained premium of 18-40% persists. Deviations exist not only in fund flows but have also permeated prices.
1. Fund Flows (H1 Established): The U.S. and Mexico command 5-6 times the Yes funds on Kalshi corresponding to their championship probability (0.1-0.3 times for non-favorite foreign teams), and 2-3 times on Polymarket; Kalshi sees 2.2-2.5 times higher funds concentrated on the U.S.-Mexico duo. Deviation magnitudes vary monotonically with platform accessibility to the country's population—imbalance stems from platform entry rather than differentiated team assessments.
2. Pricing (H2 Established): The same two teams consistently exhibit an 18-40% premium on Kalshi relative to the global platform, while all non-native team price differences are within ±3%. In places where deviation-prone populations trade, domestic team demand outpaces arbitrage.
3. Methodological Implications: When referencing market price forecasts as "crowdsourced consensus probabilities," platform entry structures must be considered. For nationally bound events, platform-restricted prices include a measurable domestic component; cross-platform comparison (or against a global platform) can offer a more equitable probability reading.
The identification strategy in this article—within-group odds comparison + cross-platform bias + same-day price comparison—relies on no user profile data and can be replicated solely from public transaction records. This framework can be directly extended to other nationally bound events (elections, Olympics, regional policy markets) and provides a template for quantitatively monitoring cross-platform price divergences.
Join the official Coincamps community:
Telegram: https://t.me/coin_camps
Recommended
Desk: Brent Crude Tops $110, Musk's Net Worth Drops 528.6 Billion in Four Days After Tesla Roadster Launch
Oct 17, 21:49
JST Fifth Buyback and Burn Successfully Concludes: Over 170 Million Tokens Worth Approximately $23.53 Million Burned, Buyback Mechanism Set for Comprehensive Upgrade
Oct 17, 20:10
BitTorrent Brand Upgrade and Initial BTT Buyback & Burn Launch Simultaneously, Dual Engines Usher in New Era of Web3 Infrastructure
Oct 17, 20:00
Asia Market Daily: Japan's BOJ signals more rate hikes while Korea targets offshore perpetual platforms (2026/10/17)
Oct 17, 17:01Why did Papertrade backfire on you?
Oct 17, 17:01
The 'Strict Father' of Northern Myanmar: This Company Deploys 200,000 "AI Best Actors" to Strike Back Against Scammers
Oct 17, 15:34