Gold Technicals Have Shifted, Institutions Interpret Gold Surge; Will Short Covering Fuel the Rally?

TL;DR
· The Market Ear believes that the initial correction in gold has absorbed some speculative froth, with technicals, positioning, and the macro setup aligning.
· Gold price broke above the 50-day moving average on August 5th and surpassed $4200, shifting the short-term focus from "can it break" to "can it hold."
· Speculative positioning remains low, CTAs are still short, and with a weakening dollar and support from Chinese demand, the post-breakout rally could be amplified. · However, fakeouts, dollar rebounds, and option time decay remain key risks to this tactical trade.
The Market Ear believes that after months of consolidation, gold is seeing technicals, positioning, and macro drivers aligning. Previous speculative fervor has notably cooled off, but structural demand such as Chinese buying interest remains, while low speculative positioning and CTA shorts provide potential fuel for a rebound.
At the time of this article, gold is testing the 50-day moving average. The author suggests that if the gold price can close above $4200, it may trigger a more significant short-covering rally.
This trigger condition was subsequently met. On August 5th, spot gold surged approximately 4.4%, closing near $4250, breaking above the 50-day moving average around $4160, and rising to a nearly seven-week high. Therefore, what needs to be observed now is not whether gold can touch a key level, but whether it can sustain its position after the breakout.
The focus of this commentary is a tactical trading opportunity, but its assessment is based on the premise that structural gold demand still exists: if the technical breakout is confirmed, low position chase, CTA short covering, and increased volatility in the options market could amplify a regular rebound into a faster uptrend.
The Breakout Has Occurred, Now It's About Holding Ground
The most direct change in gold comes from the technicals.
At the time of the article, gold is breaking above the downtrend line formed since the previous high and showing the strongest bullish candle in weeks, retesting the 50-day moving average for the first time in months. The author views $4200 as the ideal closing confirmation level, believing that surpassing this level could trigger a more forceful short squeeze.
Subsequently, gold has indeed broken above this level. According to Reuters, on August 5th, spot gold rose to $4264.93 at one point, maintained levels above $4250 at the close, and simultaneously broke above the 50-day moving average around $4160.
The 50-day moving average is one of the widely followed mid-term trend indicators in the market. If the gold price rises above this level, it may attract some trend-following funds and prompt short covering. However, if the price quickly falls back below the average, this breakout may still prove to be a false signal.
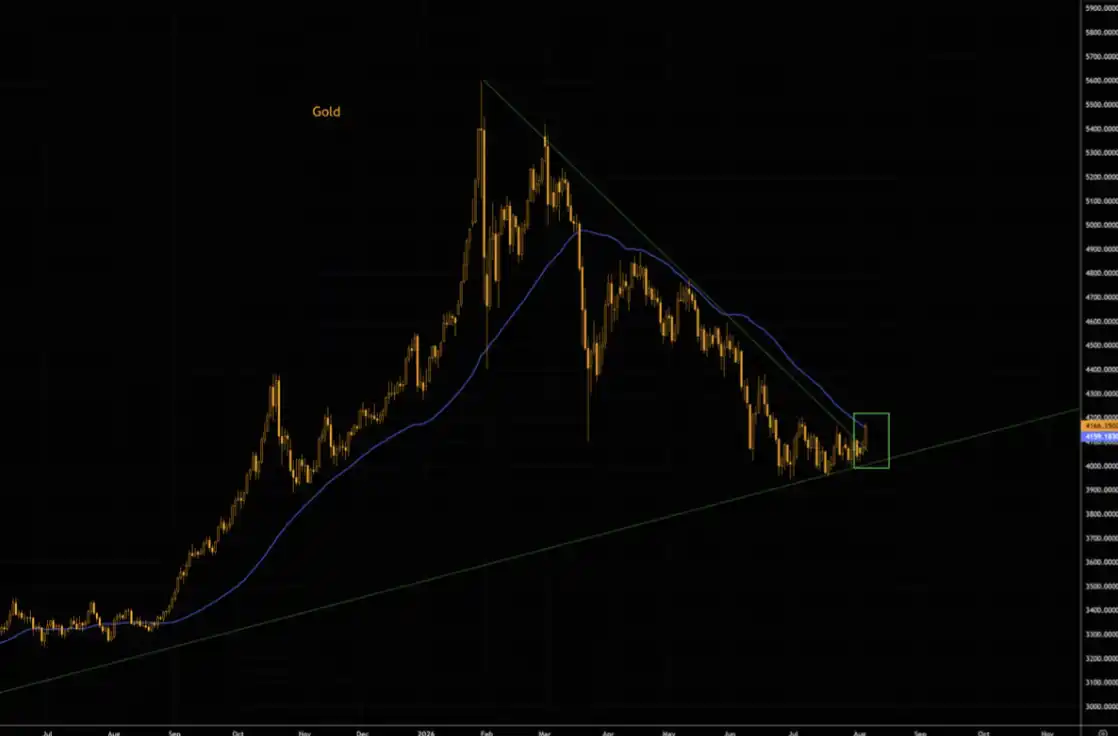
Gold has broken above the downtrend line since its all-time high and retested the 50-day moving average. Chart Source: LSEG Workspace.
This is also crucial for the "Gold Reset Completion." Gold did not just start from a low point but after reaching a high at the beginning of the year, cooling off speculative fervor, and a pullback in positions, it has returned to a level that could trigger systemic fund action.
Gold Breaks Key Technical Level, Macro Environment Opens Up Recovery Space
Weakening Dollar Provides Tailwind for Gold Rebound
Aside from the technical breakout, the weakening dollar is also supporting gold.
The chart shows that the last time the US Dollar Index was at a similar level, the gold price was about $200 higher than it is currently. This difference should not be simply interpreted as gold price necessarily needing to rise by $200 to catch up. The relationship between the dollar and gold is not one-to-one, with real interest rates, central bank demand, geopolitical risks, and investor positions all influencing the relationship between the two.
It is more suitable as a relative price signal: Gold's previous reaction to a weak dollar may not have been sufficient. If the dollar continues to weaken, and speculative positions are not yet significantly crowded, the tailwind from the forex side is more likely to be amplified by technical funds.
The sharp rise in gold on August 5 was not only driven by technical factors. Reuters listed the weakening dollar, falling US Treasury yields, and market expectations of easing tensions in the Middle East as the main reasons for that day's gold price increase. In other words, the 50-day moving average is a fund trigger, while the dollar and interest rate environment are crucial conditions for the sustainability of the breakout.
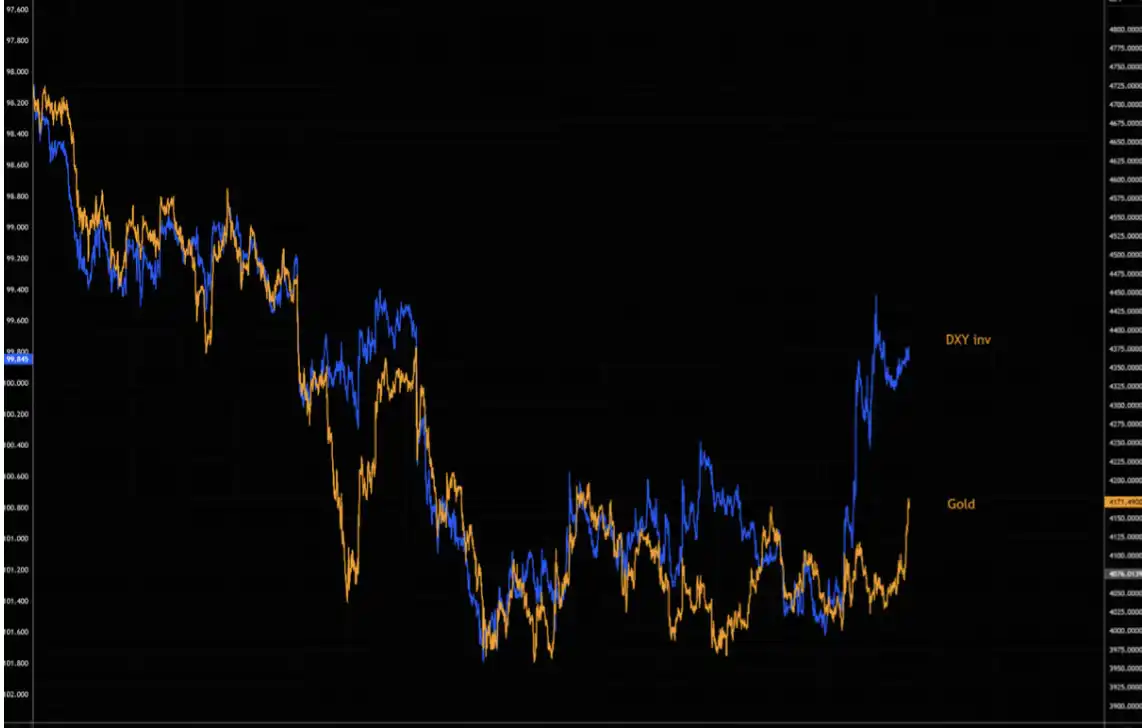
At the current US Dollar Index level, the gold price is about $200 lower than the previous corresponding range. Chart Source: LSEG Workspace.
Japanese Long-term Yields Also Point to Recovery Space
Looking at the historical relationship between Japanese long-term government bond yields and gold, further reasons for gold's continued recovery can be found.
The article suggests that before the speculative rally at the beginning of the year, gold had a high correlation with Japanese long-term yields. Subsequently, speculative fervor pushed gold to a level significantly higher than the position corresponding to this historical relationship. After a preliminary pullback, much of this excessive rise has been digested, but Japanese long-term bond yields are still rising, creating a significant gap between the two.
This relationship cannot be treated as a stable gold pricing formula. The Japanese long-term yield and gold price may be simultaneously affected by factors such as inflation, fiscal risk, and global term premium, and correlation does not imply direct causation. However, it provides another basis for judgment: the previous gold correction has already digested some overheating, while some macro variables still point to room for recovery.
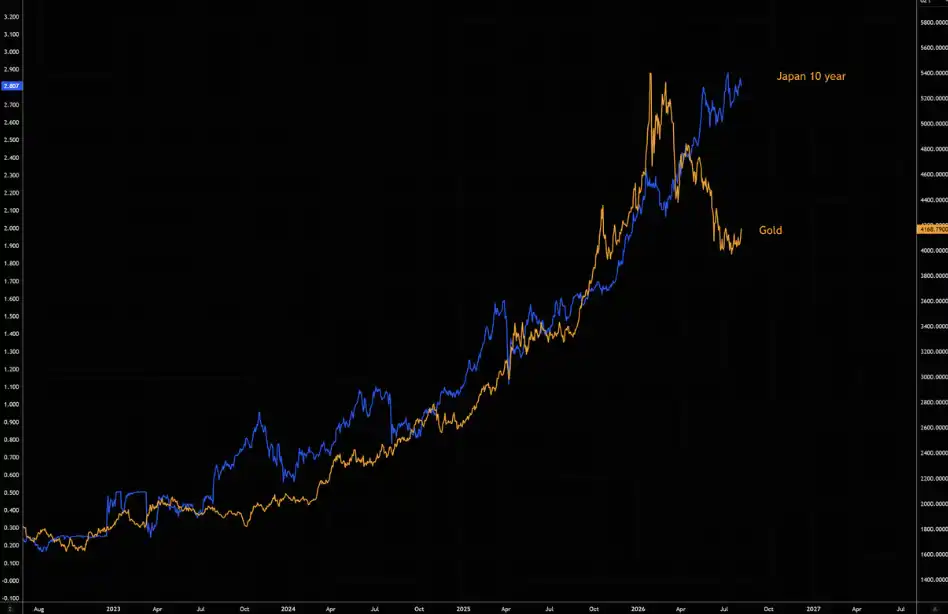
After the gold pullback, the Japanese long-term yield is still rising, creating a gap between the two. Chart Source: LSEG Workspace.
Continued Structural Support from Chinese Demand
Besides short-term technical signals, Chinese demand remains a key support for gold.
According to data compiled by the World Gold Council based on official reserve data, the People's Bank of China added around 8 tons, 10 tons, and 15 tons of gold in April, May, and June 2026, respectively. Along with about 7 tons in the first quarter, the accumulated increase in the first half of the year is around 40 tons, bringing the official gold reserves to about 2346 tons by the end of June.
A chart from Goldman Sachs referenced in this article also highlights strong UK exports of gold to China as a sign of continued purchases by the Chinese central bank; an increase in private imports is seen as evidence of steady physical demand in China.
UK export data to China itself does not directly differentiate between central banks, commercial banks, and private buyers, so it can only serve as indirect evidence of strong Chinese demand. It can be confirmed that China's official gold reserves continue to increase; whether private sector demand continues to increase significantly still needs to be observed in conjunction with data on imports, exchange inventories, and physical premiums.
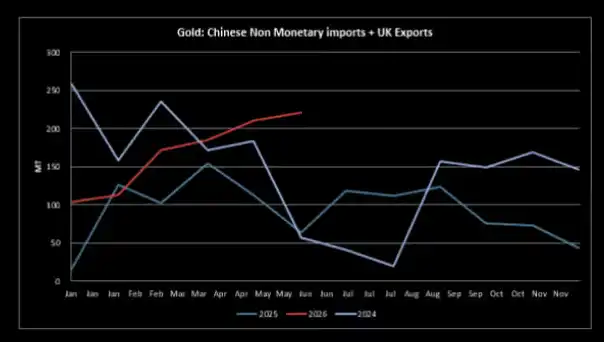
Goldman Sachs interprets the changes in UK gold exports to China and private imports as evidence that Chinese official and private demand continue to support the market. Chart Source: Goldman Sachs.
Low Positioning Allows for Buying Opportunity on Breakout
The most notable aspect of this gold trade is the positioning.
Since May, gold speculators have already rebuilt some long positions, but overall positioning is still relatively low by historical standards. In other words, gold has not returned to a state of highly crowded long trading.
Low positioning has two implications. If the gold price is just rebounding, the non-crowded positioning means that there may be less pressure from concentrated profit-taking; if the breakout is further confirmed, funds that have not yet entered may be forced to buy, amplifying short-term gains.
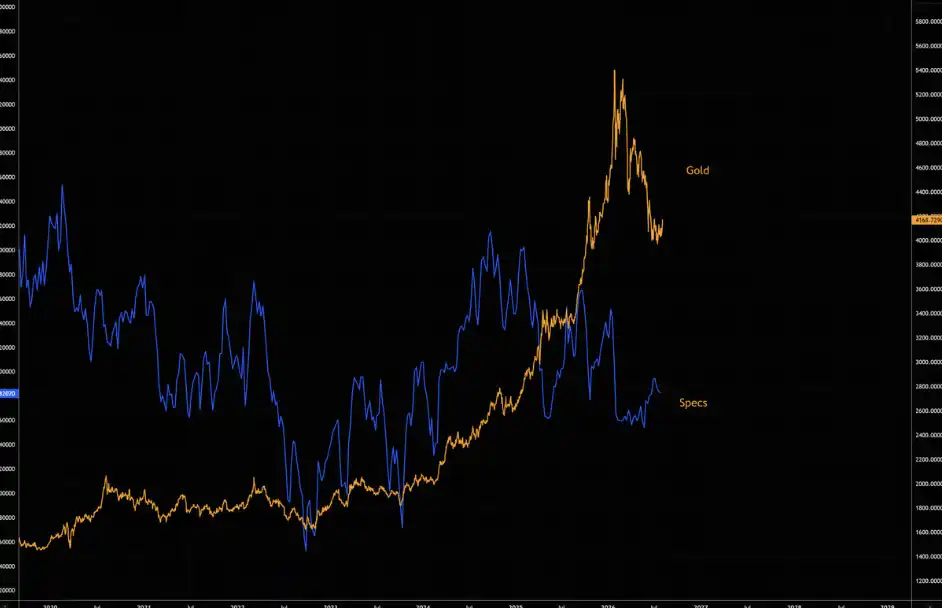
Gold Speculators Positioning Chart. Gold speculators have partially rebuilt their long positions since May but remain below historical highs. Chart Source: LSEG Workspace.
The speculative positioning in the Chinese market has not shown a significant increase either. According to Goldman Sachs indicators, the SHFE gold speculative positioning is only around 1% higher than the recent lows.
This number represents a Goldman Sachs-adjusted positioning indicator and should not be directly equated with the gold total open interest published by the SHFE. A more cautious interpretation is that physical demand in China continues to provide support, but speculative funds in the futures market have not aggressively chased the rally.
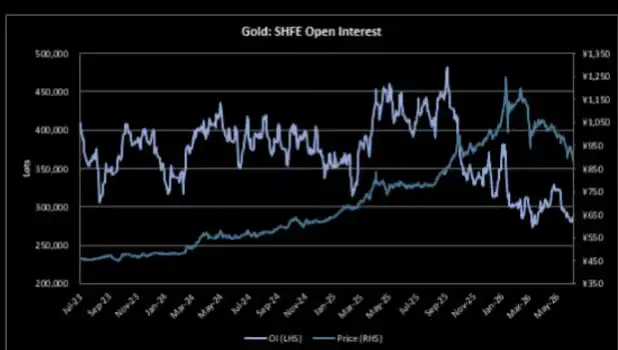
SHFE Gold Speculative Positioning Chart. Goldman Sachs indicators show that SHFE gold speculative positioning remains close to recent lows. Chart Source: Goldman Sachs.
CTA Shorts Could Flip to Passive Buying
More direct potential fuel than low speculative positioning comes from CTAs.
Goldman Sachs models indicate that CTA funds still hold gold short positions. For trend-following strategies, if the gold price breaks key technical levels and continues to rise, the models may first trigger short covering, followed by further transitioning to long positions.
This implies that the driving force behind gold's rise may not only be active long funds but also short covering and systematic buying. Low positioning is responsible for providing chasing room, and CTA shorts may potentially transform into more direct passive buying after a breakout.
However, different CTA models use different trend periods and trigger conditions, so it is not as simple as assuming that crossing above the 50-day moving average will prompt all systematic funds to buy simultaneously. Only when the breakout continues and the trend signal is confirmed on multiple time frames, CTA covering and flipping to long positions can sustain the momentum.
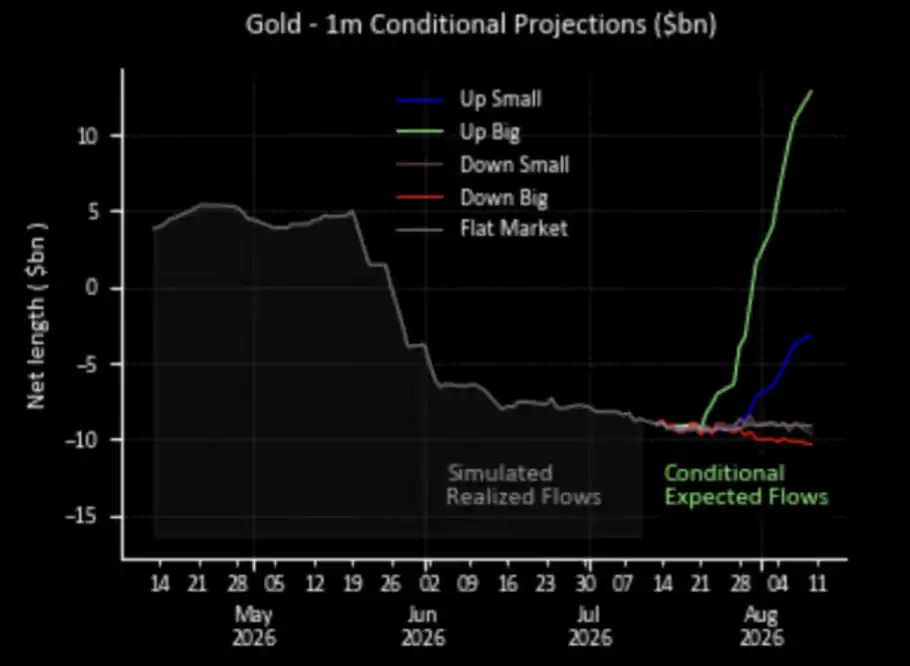
CTA Gold Positioning Model Chart. Goldman Sachs models show that CTAs still hold gold shorts; if the uptrend continues, systematic buying may amplify the rally. Chart Source: Goldman Sachs.
Volatility Decline Enhances Option Trading Odds
The options market has also provided a window for this tactical positioning.
The Gold Volatility Index (GVZ) has significantly retraced after a earlier rally this year, with recent consolidation further suppressing implied volatility. While GVZ is not at an all-time low, the cost of using options to bet on a gold breakout has decreased compared to earlier.
Gold options typically exhibit some upward volatility skew. When the gold price surges, the market demand for call options and implied volatility may rise in tandem, enhancing the option's leverage compared to simply holding the spot or an ETF.
Using the example of a GLD September 390/430 call spread, it is estimated that its maximum potential payout is approximately 8 times the initial premium. This 8x multiplier represents the maximum payout, not the strategy's win rate; accounting for net returns would require deducting the initial premium and trading costs.
The appeal of such strategies lies in cost and payout ratio rather than a high win rate. They are suitable for betting on gold experiencing a "breakout followed by acceleration" within the timeframe. However, if the gold price only mildly rebounds or tests key levels repeatedly without continuing upward, the option's time value will continue to erode.
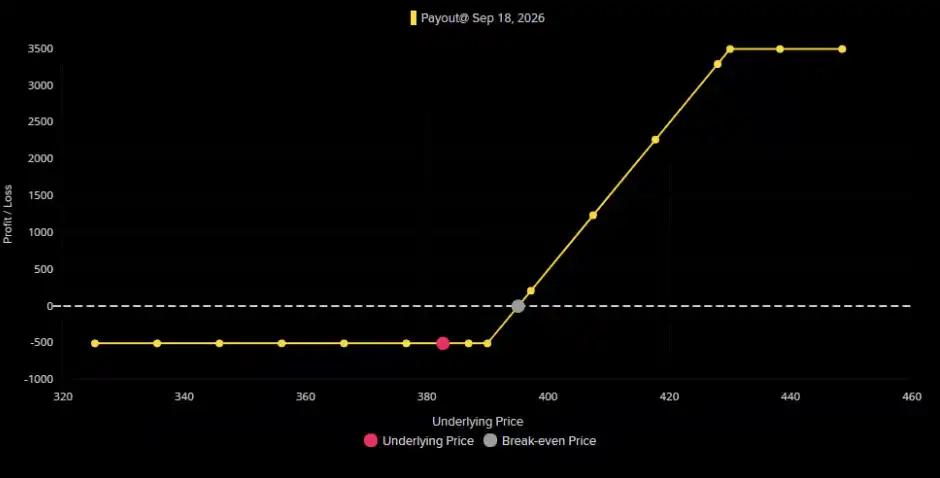
Profit diagram of the GLD September 390/430 call spread. This article estimates that the maximum potential payout of this call spread is approximately 8 times the initial premium. Chart Source: LSEG Workspace.
Whether the Breakout Can Sustain Depends on the US Dollar and Follow-Through Buying
The core assessment is that gold has already digested some speculative froth in the previous correction, with technicals, the macro environment, structural demand, and positioning starting to align.
The first trigger condition has emerged: gold broke above the 50-day moving average on August 5 and surpassed $4200. What needs to be observed next is no longer whether key levels can be touched but whether the breakout can sustain.
If the gold price continues to hold above the 50-day MA, low-position chasing, CTA short covering, and a rise in option implied volatility could create a mutually reinforcing cycle. Conversely, a resurgence of the US dollar, an increase in real US yields, or a swift drop back below the 50-day MA could prove this rally to be a false breakout.
While the People's Bank of China and physical demand can provide structural support, they alone are insufficient to guarantee a sustained short squeeze. The incomplete recovery of speculative positioning indicates both upside potential and incomplete market validation. Gold has made a technical breakout, but whether it transitions from a rebound to a new trend phase will depend on the subsequent price and positioning changes over the next few trading days.
Recommended
Desk: Brent Crude Tops $110, Musk's Net Worth Drops 528.6 Billion in Four Days After Tesla Roadster Launch
Oct 17, 21:49
JST Fifth Buyback and Burn Successfully Concludes: Over 170 Million Tokens Worth Approximately $23.53 Million Burned, Buyback Mechanism Set for Comprehensive Upgrade
Oct 17, 20:10
BitTorrent Brand Upgrade and Initial BTT Buyback & Burn Launch Simultaneously, Dual Engines Usher in New Era of Web3 Infrastructure
Oct 17, 20:00
Asia Market Daily: Japan's BOJ signals more rate hikes while Korea targets offshore perpetual platforms (2026/10/17)
Oct 17, 17:01Why did Papertrade backfire on you?
Oct 17, 17:01
The 'Strict Father' of Northern Myanmar: This Company Deploys 200,000 "AI Best Actors" to Strike Back Against Scammers
Oct 17, 15:34