Wall Street FOMO Rally Continues to Heat Up, Four-Day Gains Exceed Three-Month Volatility?
After the close on August 4th, Wall Street saw a notably accelerating pace. The S&P 500 Index surged 5.8% over the course of the four trading days ending that day. According to Reuters, the options market also showed a bullish skew not seen in at least four years.
An increase itself does not equate to FOMO. What truly set this rally apart is how quickly prices moved upward and how the options market simultaneously marked the price for both upside and downside risks. On August 4th, the closing data recorded by FRED also indicated that the stock market continued to rise, and the VIX volatility index, which measures expected volatility, also rose at the close. Optimists did not completely suppress the volatility.
Why Four Days Seemed Longer Than Three Months
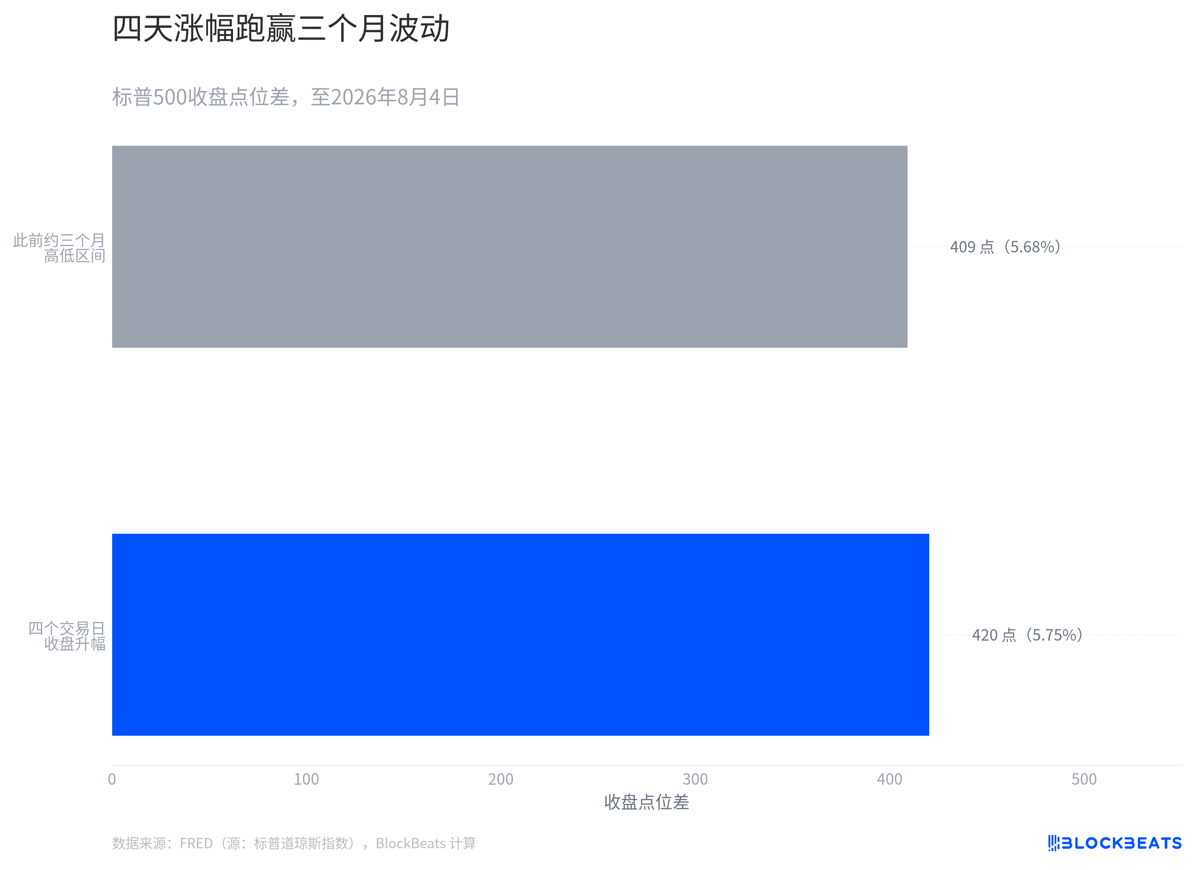
According to the S&P Dow Jones Indices daily closing data recorded by the Federal Reserve Economic Data (FRED), in the same closing caliber, the upward movement over these four days has slightly exceeded the point difference between the previous approximately three months' highest and lowest closing.
Comparing these two periods of change side by side is not meant to treat the four-day gain and the three-month high-low range as the same indicator. The former is a direction, while the latter is a range. Placing them on the same scale is to observe a change in trading rhythm, where the closing price range formed over several months has been surpassed by the one-way movement of four trading days.
The price path itself cannot prove the psyche of every participant. What it can illustrate is that the continuous upward closing over four trading days quickly raised the price for subsequent entry. Reuters summarized the phenomenon of traders chasing this rally as FOMO. The speed seen in the chart is part of what can be tested back into the price sequence, supporting such claims.
How Rare This Has Been in Nearly a Decade
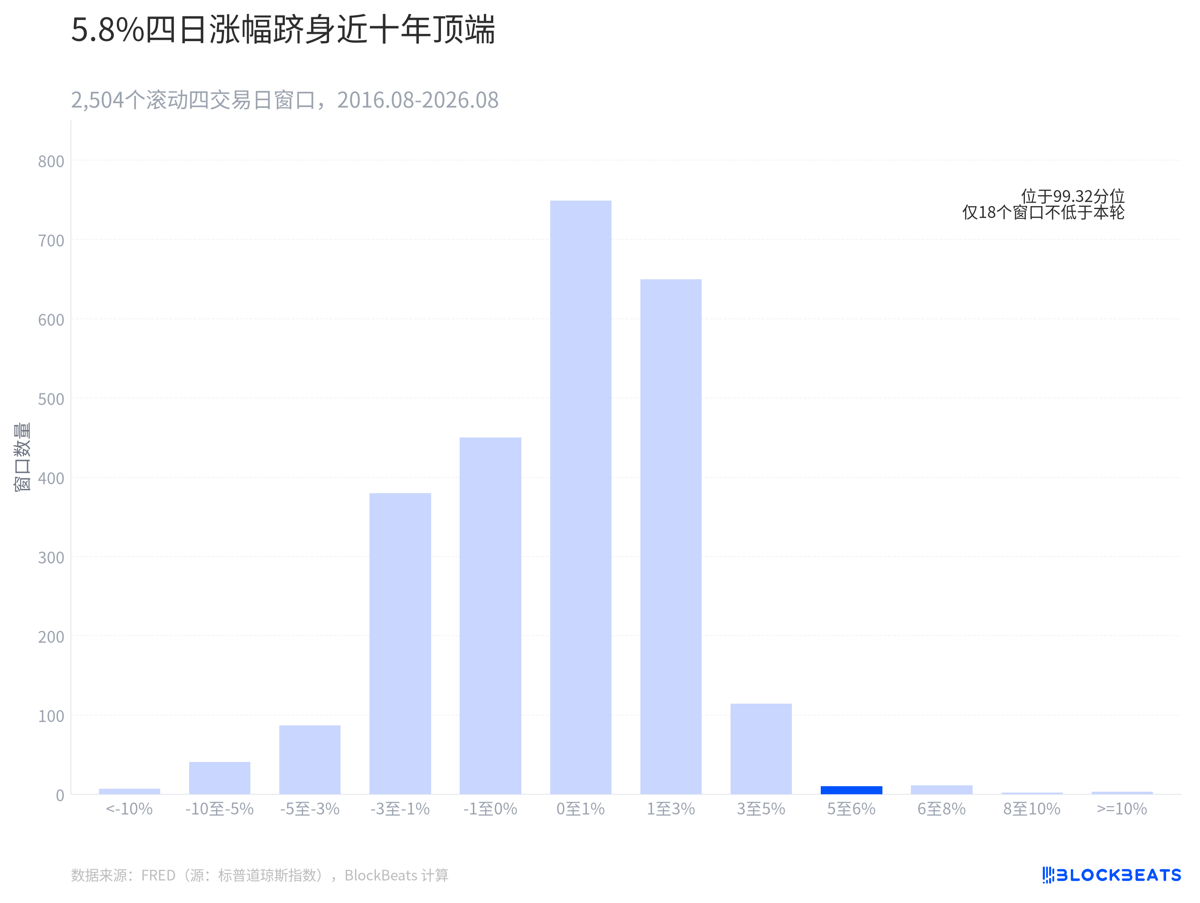
By rolling calculations based on FRED's nearly ten years of S&P 500 daily closing data, there are 2,504 four-trading-day windows. The current 5.7458% surge is at the 99.32 percentile, placing it in the sparse area on the far right of the chart.
Based on FRED's recorded data, including the current rally, only 18 windows have had a four-day gain not lower than this level. Such four-day magnitudes are not common.
How Bullishness and Hedging Were Simultaneously Present in Options
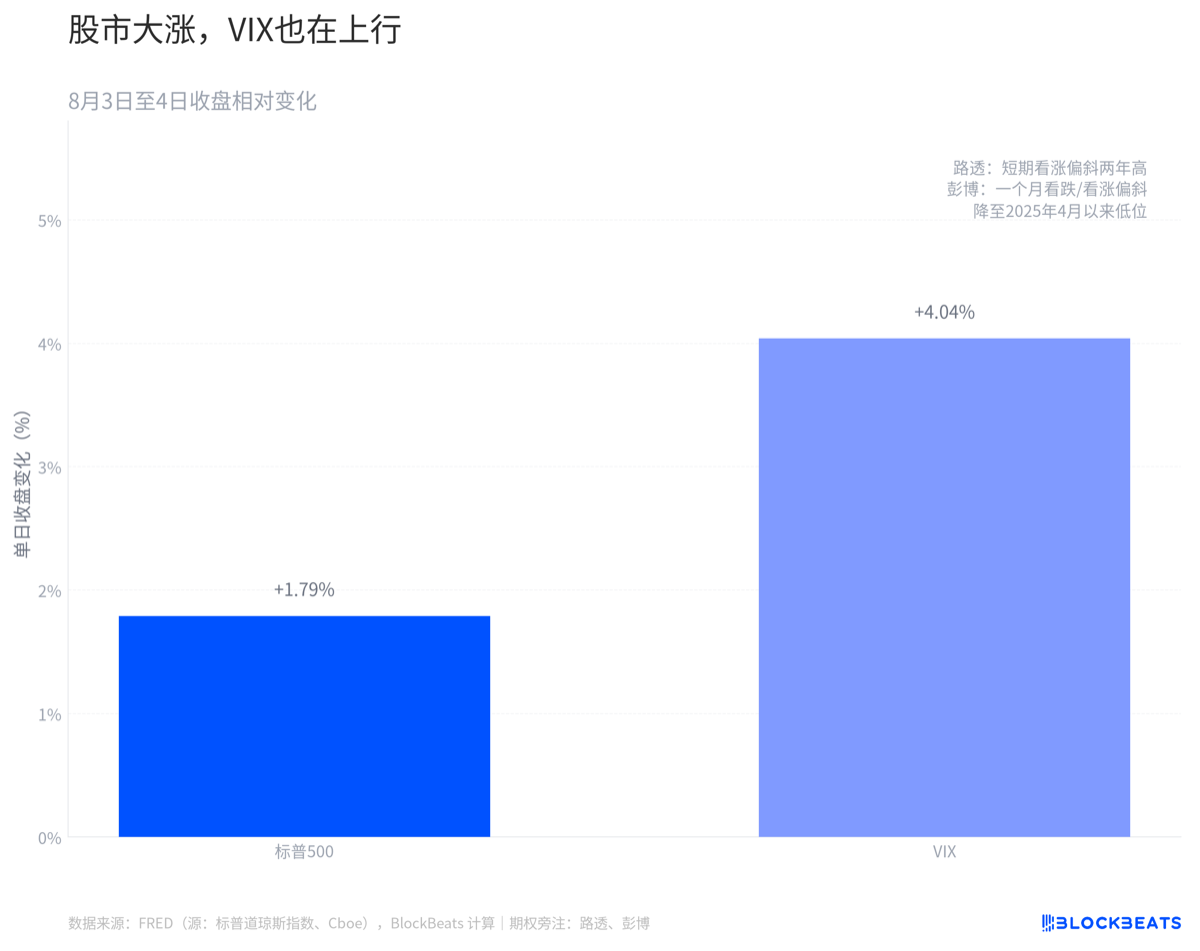
According to the S&P Dow Jones Indices and Chicago Board Options Exchange (Cboe) closing data recorded by FRED, the S&P 500 rose by 1.79%, while the VIX closed up by 4.04%. Both prices moving in the same direction at least indicate that by the end of the day, the market had not entirely discounted the pricing for future volatility.
According to Reuters, the skewness of short-term options has reached a two-year high. Data from options analytics firm Trade Alert indicates that the one-month average daily S&P 500 call/put ratio is 0.9, sitting in the most bullish territory in at least four years.
Recommended
Desk: Brent Crude Tops $110, Musk's Net Worth Drops 528.6 Billion in Four Days After Tesla Roadster Launch
Oct 17, 21:49
JST Fifth Buyback and Burn Successfully Concludes: Over 170 Million Tokens Worth Approximately $23.53 Million Burned, Buyback Mechanism Set for Comprehensive Upgrade
Oct 17, 20:10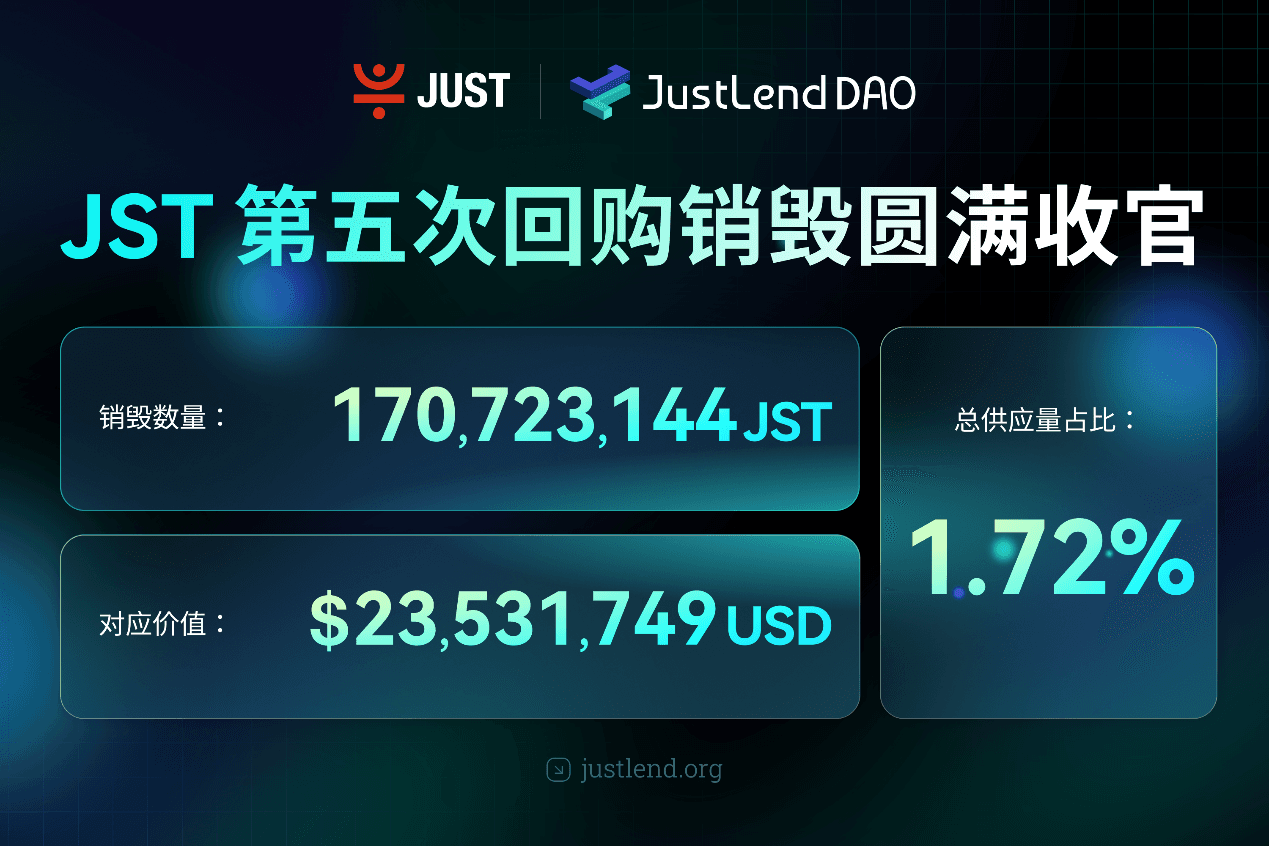
BitTorrent Brand Upgrade and Initial BTT Buyback & Burn Launch Simultaneously, Dual Engines Usher in New Era of Web3 Infrastructure
Oct 17, 20:00
Asia Market Daily: Japan's BOJ signals more rate hikes while Korea targets offshore perpetual platforms (2026/10/17)
Oct 17, 17:01Why did Papertrade backfire on you?
Oct 17, 17:01
The 'Strict Father' of Northern Myanmar: This Company Deploys 200,000 "AI Best Actors" to Strike Back Against Scammers
Oct 17, 15:34