Gold Price Returns to $4350, Has the Precious Metal Pullback Ended?

TL;DR
· Sprott believes that the gold and silver pullback in 2026 resembles a cyclical correction within a long-term bull market, with gold breaking above $4,350/oz on August 7.
· Global central banks net purchased 289 tons of gold in the second quarter, nearly five times the approximately 57 tons in the first quarter after the correction, but the first-half gold buying volume remains the lowest since 2022.
· Silver is expected to face supply deficits for the sixth consecutive year, but industrial demand is slowing down, and short-term volatility is likely to be amplified by the US dollar, real interest rates, and liquidity.
Sprott Asset Management recently released a precious metals report, characterizing the gold and silver pullback since 2026 as a cyclical correction within a long-term bull market, rather than the end of the trend since 2025.
As of August 7, gold briefly rose above $4,350/oz, marking a seven-week high. Prior to this, the gold price stabilized in the $4,000–$4,100 range, indicating a return of safe-haven demand and improving market sentiment.
The report attempts to address a straightforward question: after gold rose by 64.58% and silver by 147.95% in 2025, the significant pullback in the first seven months of 2026, does it signal a trend reversal or a rebalancing after leverage and fund sentiment clearing?
As of July 31, gold closed at $4,046.15/oz, down 6.33% year-to-date; silver closed at $57.60/oz, down 19.63% year-to-date. Despite both metals retracing from the beginning of the year, prices remain significantly higher than a year ago. For investors, what truly matters is not whether gold and silver experience a pullback, but whether the long-term demand supporting the previous rally has changed.
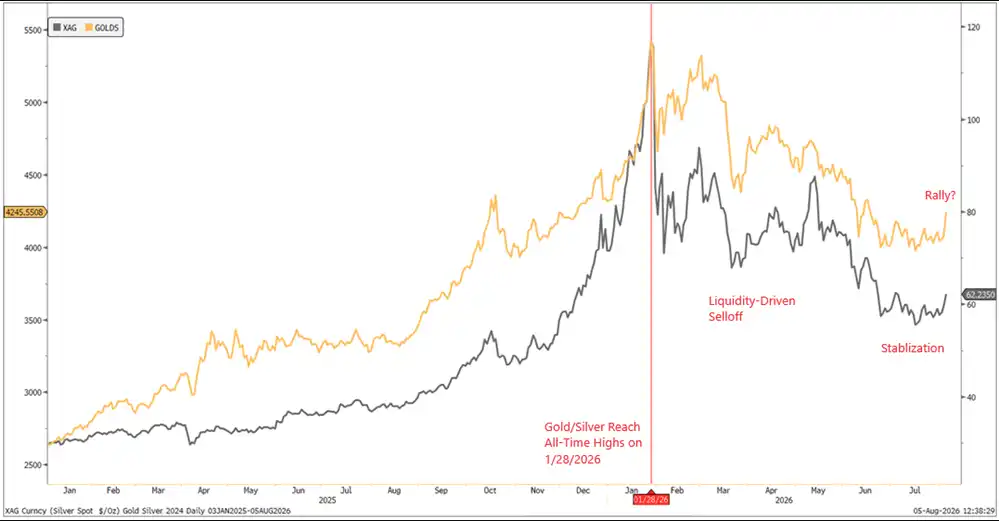
Gold and silver saw substantial gains in 2025, followed by a notable pullback from early 2026 highs, but by the end of July, prices remained higher than a year agoGold Price Stabilizes near $4,000 as Futures Funds Begin to Flow Back
Sprott's assessment is not that precious metals will not continue to decline, but that this pullback has not yet undermined the long-term supportive factors.
In 2025, gold and silver saw excessive gains, reaching historic highs in early 2026, leading to an accumulation of leverage and profit-taking. Sprott believes that the unexpected tightening of global liquidity due to the March geopolitical conflict forced some leveraged investors to sell gold to raise cash; as the second quarter began, easing US-Iran tensions, a decline in oil prices, a strong US dollar, and expectations of sustained high US interest rates further suppressed precious metals prices.
By early summer, some selling pressure gradually eased, and gold regained physical demand and central bank buying support near $4,000, then broke through $4,350 on August 7. Silver's volatility increased, but it also found support in the $55–$60 range and briefly rose back above $60.
Futures positioning also showed signs of a rebound. According to Saxo Bank's analysis of CFTC data for the week ending August 4, hedge funds had already increased their precious metals exposure before gold made a technical breakthrough. Silver futures speculative net long positions increased by 32% compared to the previous period, and gold net longs continued to rise, reaching a high not seen since January.
At the same time, speculators reduced their long dollar positions by about $13 billion in a week, the largest weekly decline in six years. However, the overall dollar position remains significantly long, and it is still too early to conclude that the dollar trend has reversed.
COT data is more suitable for observing short-term fund sentiment. It indicates that precious metals are once again attracting speculative funds, but it cannot independently prove that a new bull market has started.
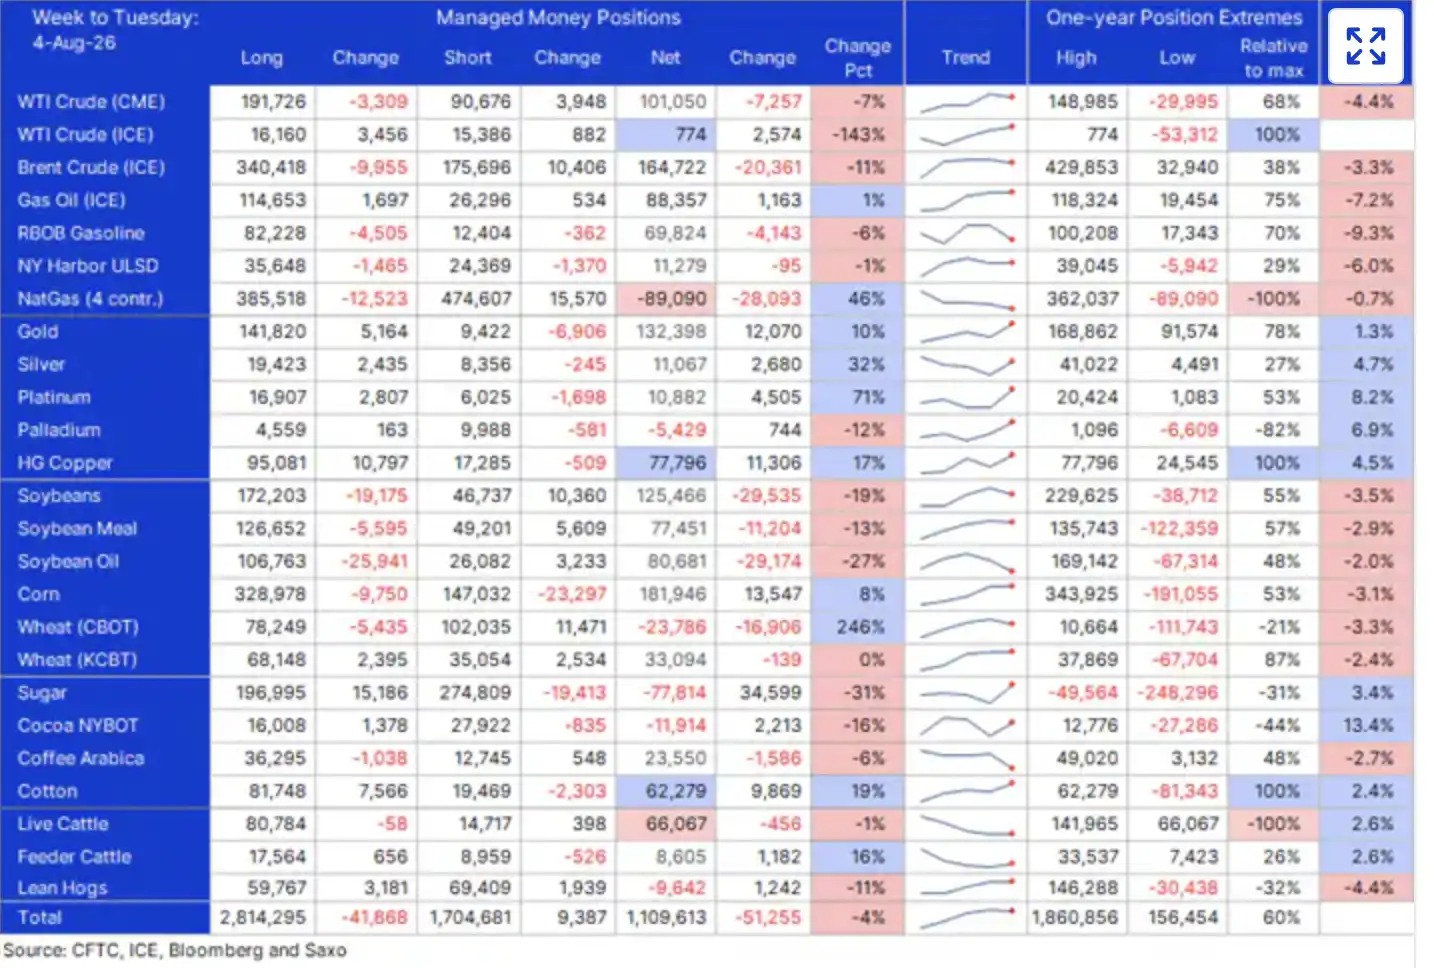
As of the week ending August 4, gold managed fund net longs rose to 132,000 contracts, reaching a high not seen since January; silver net longs increased by 32% to about 11,000 contracts, but overall positions remain relatively low.Central Banks Net Bought 289 Tons of Gold in Q2, But First-Half Demand Has Not Fully Recovered
Gold's long-term support still relies on central banks and sovereign wealth funds.
World Gold Council data shows that global central banks' net gold purchases reached 289 tons in the second quarter of 2026, about five times the 57 tons revised in the first quarter, a 62% year-on-year increase, and the highest second-quarter level on record.
However, this data also has another side. Due to a significant downward revision in first-quarter gold purchases, central banks' net gold purchases in the first half of 2026 totaled 345 tons, the lowest first-half level since 2022. This means that central bank demand significantly recovered in the second quarter, but whether it will re-enter a sustained acceleration phase still requires confirmation from subsequent data.
From the data that has been disclosed, Poland and China were more significant buyers in the second quarter, increasing their holdings by about 51 tons and 33 tons, respectively. Official institutions continue to allocate gold, driven by long-term factors such as sovereign debt expansion, fiscal deficits, geopolitical diversification, and reserve diversification.
Gold is not tied to a single sovereign credit, so it is still viewed by some central banks as a strategic asset outside of traditional foreign exchange reserves. This type of buying may not necessarily continue to drive short-term prices higher, but it could provide support to physical demand during ETF outflows, deleveraging, or weakening investor sentiment.
Whether Central Bank Gold Purchases Can Maintain Strength will also be a key variable in assessing the stability of support near $4000.
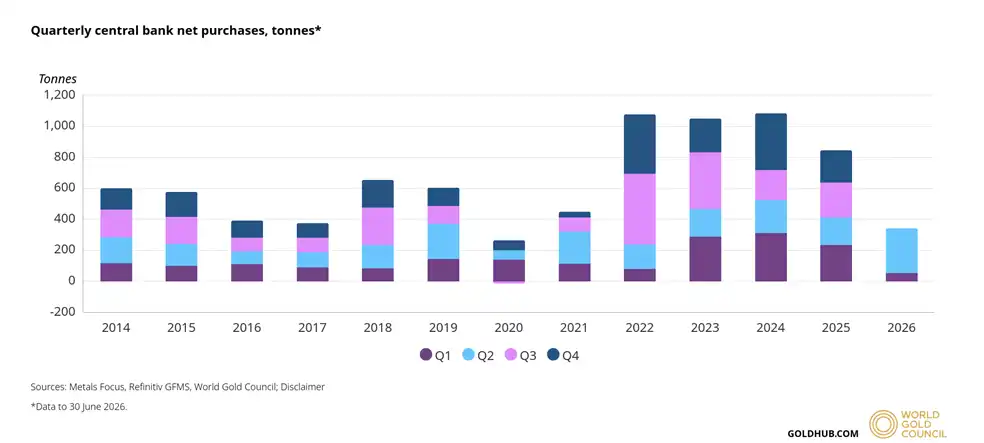
Global central bank net gold purchases in the second quarter of 2026 reached 289 tons, approximately five times the revised 57 tons in the first quarter, setting a new high for the second quarter in recorded history; however, the net gold purchases in the first half of the year are still the lowest since 2022Silver Industrial Demand Slows Down, Supply Deficit Continues to Expand
The pricing logic of silver is more complex than that of gold. It possesses both monetary and investment attributes, and is also influenced by industrial demand, mine supply, and inventory changes.
The "World Silver Survey 2026" released by the Silver Institute and Metals Focus in April revealed that the global silver market faced a deficit of 40.3 million ounces in 2025, which is projected to increase to 46.3 million ounces in 2026, marking the sixth consecutive year of undersupply.
A persistent deficit implies that the market still needs to deplete above-ground stocks to bridge the supply-demand gap. However, industrial demand in 2026 is not uniformly growing.
The report anticipates that silver industrial demand in 2026 will decrease to 639.6 million ounces, a year-on-year decline of approximately 3%; within this, silver demand for photovoltaics is expected to drop by 19%. This mainly reflects the high silver price prompting photovoltaic companies to reduce the silver content per unit product, rather than all industrial applications expanding simultaneously.
Infrastructure investment in the grid, electrification, AI infrastructure, and advanced manufacturing remain long-term sources of silver demand, but it should not be oversimplified that all industrial subsectors will grow in 2026. The widening silver deficit is not only determined by industrial demand but is also related to mine supply, recycling supply, and changes in investment demand.
This is precisely why silver volatility is often greater than that of gold. During an uptrend, the smaller market size, inventory tightness, and speculative fund inflows amplify price elasticity; during a downtrend, concerns about industrial demand, tightening liquidity, and deleveraging can deepen the decline.
Silver has declined by nearly 20% in the first seven months of 2026, significantly underperforming gold. As prices stabilize in the $55–60 range, the market is reassessing the impact of ongoing deficits, a rebound in investment demand, and gold's recovery on silver.
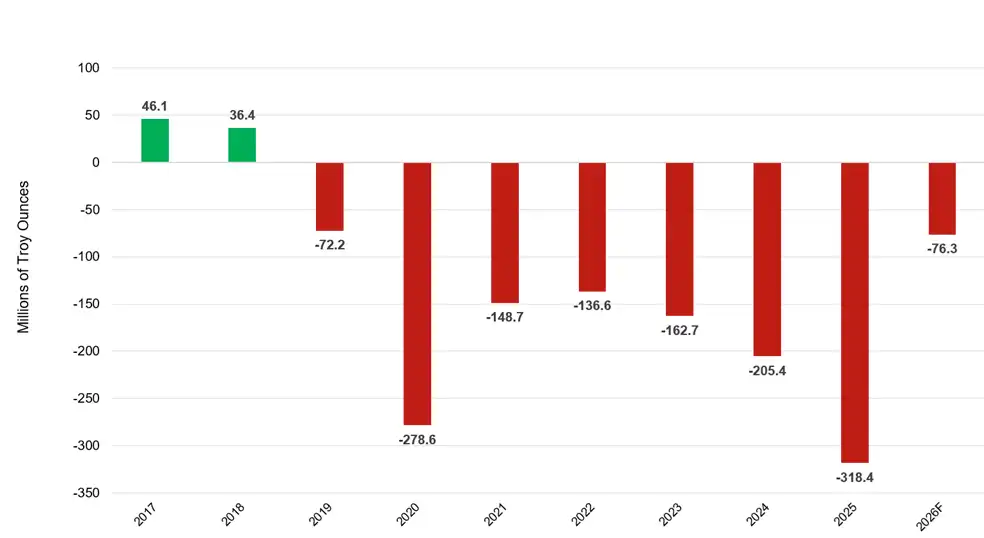
A supply deficit of 40.3 million ounces was observed in the global silver market in 2025, which is projected to increase to 46.3 million ounces in 2026, marking the sixth consecutive year of undersupplyLong-Term Logic Remains Unbroken, Short-Term Reversal Still Pending Confirmation
Sprott's long-term bullish stance is very clear, but "a pullback is not the end of the bull market" cannot be directly equated to "a new uptrend has been confirmed."
The biggest disruption facing precious metals still comes from the macro environment. If the US dollar regains strength, real interest rates continue to rise, or global liquidity tightens again, the rebounds in gold and silver could be interrupted. Silver, due to its dual industrial nature, smaller market size, and higher leverage trading participation, may continue to experience greater short-term volatility than gold.
Central bank gold purchases and silver deficits are medium- to long-term supports, but this does not mean prices will not experience sharp pullbacks. Although central bank buying has notably rebounded in the second quarter, the scale in the first half of the year remains below the levels of recent years; while silver has seen consecutive supply shortfalls, industrial demand is slowing down; and although the COT report shows money flowing back in, futures positions may quickly reverse course with changes in the US dollar and Treasury yields.
Therefore, the significance of $4350 is not just a price point, but after gold stabilized around $4000, the market is beginning to re-examine whether the long-term bull market in precious metals still holds.
Next, whether the gold and silver rebound can continue depends mainly on four variables: whether central bank gold purchases can remain strong, if the silver deficit continues to deplete inventory, whether the US dollar and real interest rates will rise again, and if futures fund inflows can be sustained.
Existing data supports the "long-term bullish thesis remains intact," but it is still not enough to prove that a new one-way uptrend has begun.
Recommended
Desk: Brent Crude Tops $110, Musk's Net Worth Drops 528.6 Billion in Four Days After Tesla Roadster Launch
Oct 17, 21:49
JST Fifth Buyback and Burn Successfully Concludes: Over 170 Million Tokens Worth Approximately $23.53 Million Burned, Buyback Mechanism Set for Comprehensive Upgrade
Oct 17, 20:10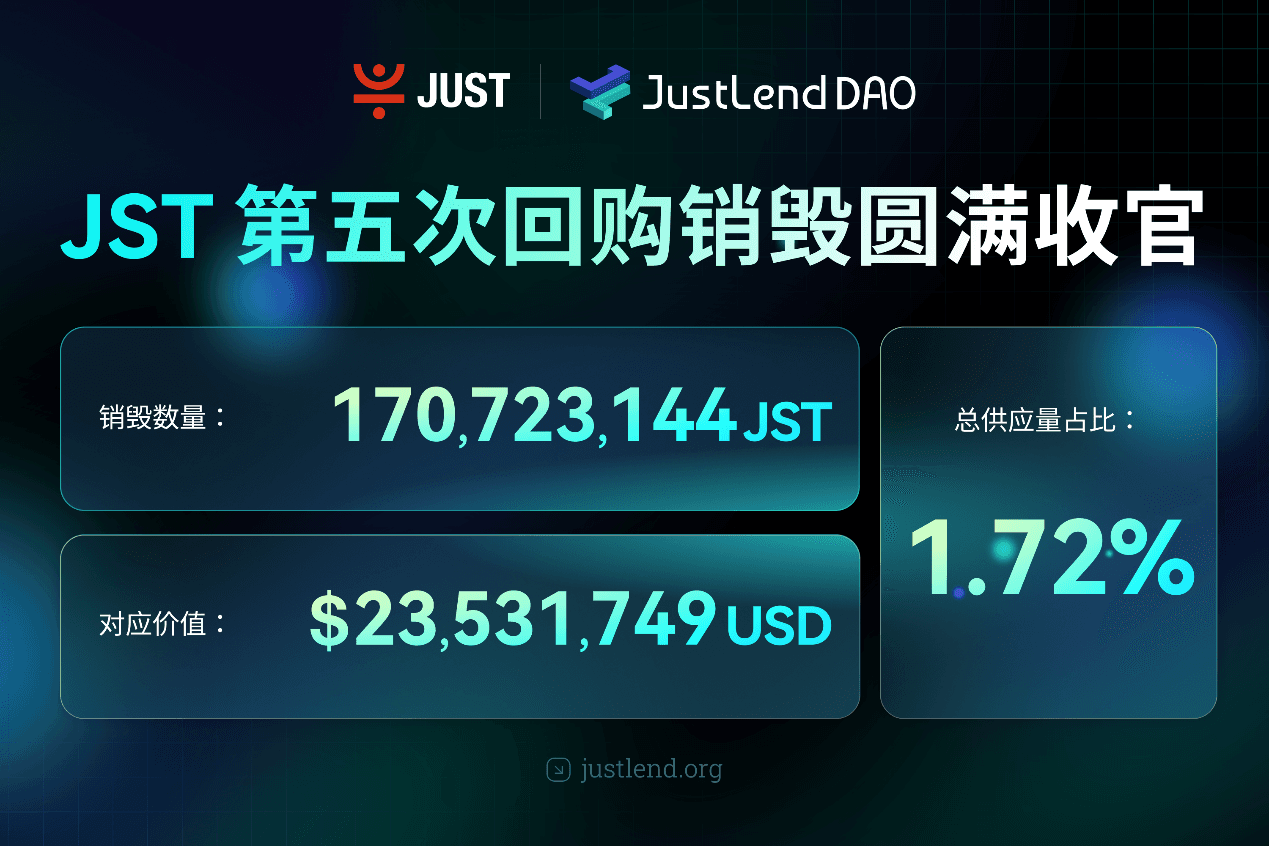
BitTorrent Brand Upgrade and Initial BTT Buyback & Burn Launch Simultaneously, Dual Engines Usher in New Era of Web3 Infrastructure
Oct 17, 20:00
Asia Market Daily: Japan's BOJ signals more rate hikes while Korea targets offshore perpetual platforms (2026/10/17)
Oct 17, 17:01Why did Papertrade backfire on you?
Oct 17, 17:01
The 'Strict Father' of Northern Myanmar: This Company Deploys 200,000 "AI Best Actors" to Strike Back Against Scammers
Oct 17, 15:34