Global Stablecoin Adoption Index 2026: India Leads

Last updated: October 8, 2026
Stablecoin adoption in 2026 is not evenly distributed across the world.
In the Chainalysis 2025 Global Crypto Adoption Index, India ranks first, the United States second, and Pakistan, Vietnam and Brazil complete the top five, with Nigeria, Indonesia, Ukraine, the Philippines and Russia rounding out the top ten (Chainalysis). Most of that top ten are emerging economies, and the majority of global stablecoin flows by transaction count occur outside the United States.
A stablecoin-specific adoption index differs fundamentally from a general crypto adoption index because it measures real-economy usage of dollar-pegged tokens for savings, remittances, payments, and inflation hedging rather than speculative trading of volatile assets.
As covered in our stablecoin adoption signals guide, the most commercially meaningful adoption metrics are repeat wallet usage, genuine payment volume after filtering exchange flows, and ramp-to-retention conversion rates rather than raw on-chain transaction totals.
This guide defines what the global stablecoin adoption index measures, maps regional and country-level adoption patterns, identifies the key drivers by region, and addresses the measurement challenges that make stablecoin adoption data more complex than the headline figures suggest.
Key Takeaways
- India ranks first in the Chainalysis 2025 Global Crypto Adoption Index, followed by the United States, Pakistan, Vietnam and Brazil; the US is the only developed market in the top five (Chainalysis).
- APAC was the fastest-growing region in the 12 months to June 2025, with on-chain value received up 69%, ahead of Latin America at 63% and Sub-Saharan Africa at 52% (Chainalysis).
- Adjusted for population, Ukraine, Moldova and Georgia lead the 2025 index, showing where crypto activity is highest relative to population size (Chainalysis).
- Real payments are a small slice of raw volume: McKinsey and Artemis estimated about $390 billion of genuine stablecoin payments in 2025 out of more than $35 trillion moved on-chain, with B2B payments at $226 billion (CoinDesk).
- USDT and USDC serve largely different user segments: USDT, about 59% of stablecoin supply on October 8, 2026 (DefiLlama), dominates emerging-market retail and remittance flows, while USDC is concentrated in institutional and regulated DeFi activity in developed markets.

Defining the Global Stablecoin Adoption Index
No single universal stablecoin adoption index exists. Several methodologies compete, each measuring a different dimension of adoption.
As covered in our top stablecoins by active wallets guide, active wallet count is the most commercially honest measure of real adoption because it counts users who are actually transacting with stablecoins rather than measuring supply or speculative trading volume.
The primary data sources each use different approaches. The Chainalysis Global Crypto Adoption Index measures on-chain value received weighted by purchasing power parity per capita and population size, deliberately capturing grassroots usage over institutional capital flows. India ranked first for the second consecutive year in 2025 and topped all four sub-indices.
CoinDesk's 2026 Global Digital Asset Adoption Index uses a timezone-based stablecoin flow model, allocating transfer activity by the local time of each transaction to capture the economic center of gravity of usage rather than blockchain settlement geography. Artemis and Allium provide adjusted volume filters that strip exchange-to-exchange flows from raw on-chain data to isolate genuine payment and transfer activity.
The Chainalysis methodology produces emerging market leaders by design. By weighting on-chain value by PPP-adjusted GDP per capita and population, a USDT transfer in Lagos or Lahore counts for more than the same amount moved between US institutional desks. This is why India, Nigeria, Vietnam, and Pakistan consistently outrank most developed nations despite lower absolute transaction volumes.
The critical measurement gap is the most important caveat in interpreting any stablecoin adoption data. McKinsey and Artemis estimated that only about $390 billion of the more than $35 trillion in 2025 stablecoin transactions reflected real-world payments, roughly 1% (CoinDesk). Any adoption ranking built on raw volume systematically overstates real-economy penetration.
Regional and Country-Level Adoption Patterns
Asia-Pacific: Grassroots leader by transaction count and ownership rate
India ranked first in the Chainalysis 2025 Global Crypto Adoption Index and topped all four sub-indices (Chainalysis), with stablecoin usage concentrated in remittances and P2P transfers.
Vietnam ranks fourth in the 2025 index and sixth on the population-adjusted ranking (Chainalysis). Stablecoin usage is driven by cross-border trade settlement, particularly in Vietnam-China commerce, and crypto earnings from gaming and content creation.
Indonesia and the Philippines both rank in the Chainalysis top ten, with large unbanked populations and high overseas worker remittance volume creating structural demand for dollar-denominated stablecoin transfers.
Pakistan ranks third in the Chainalysis 2025 index (Chainalysis). Chronic inflation and a large freelancer workforce preferring stablecoin payouts drive consistent usage.
China represents significant gray-market USDT flows for cross-border B2B trade settlement despite domestic regulatory restrictions.
Japan is growing rapidly following JFSA regulatory approvals and reduced crypto tax rates. RLUSD received JFSA approval as Japan's first Type 4 electronic payment instrument in June 2026, and SBI VC Trade distributes both USDC and RLUSD to retail and institutional clients.
Sub-Saharan Africa: Third-fastest growing region in 2025
Sub-Saharan Africa grew crypto adoption by 52% in the 12 months to June 2025, behind APAC (69%) and Latin America (63%), reflecting continued reliance on crypto for remittances and everyday payments (Chainalysis). Nigeria ranks sixth in the index, the highest-ranked African economy, with naira inflation making USDT a primary savings vehicle for many citizens.
As covered in our Yellow Card review, Yellow Card is one of the most credible proxies for measuring institutional stablecoin adoption depth on the continent.
Kenya, Ghana, and Tanzania benefit from M-Pesa ecosystem infrastructure providing last-mile fiat on-ramps for stablecoin access. South Africa has the highest absolute GDP in Africa, driving larger stablecoin transaction sizes for business treasury applications.
Standard Chartered has warned that emerging market bank deposits could shift into stablecoins over the next few years, with Egypt and Nigeria among the most exposed markets.
Latin America: Second-fastest growing region in 2025
As covered in our stablecoins in Latin America guide, Latin America is one of the fastest-growing regions for real-world stablecoin usage, with crypto adoption up 63% in the 12 months to June 2025 (Chainalysis).
Argentina ranks 20th in the Chainalysis 2025 index (Chainalysis). USDT serves as the primary inflation hedge against chronic peso devaluation, functioning as a parallel savings system rather than a speculative instrument.
Brazil ranks fifth in the Chainalysis 2025 index, the highest in Latin America (Chainalysis), with Pix instant payment infrastructure providing frictionless fiat-to-stablecoin conversion. Mexico is the primary US-Mexico remittance corridor, with stablecoins capturing a growing share of transfers.
Venezuela sees stablecoins functioning as a parallel monetary system for a significant portion of the population amid hyperinflationary conditions.
Middle East and North Africa: Regulatory clarity driving institutional and retail growth simultaneously
The UAE is a regional leader for regulated activity: Dubai's Virtual Assets Regulatory Authority framework is the most developed VASP licensing structure in the region, making the UAE the institutional tokenization hub for the MENA corridor. MENA crypto activity grew 33% in the 12 months to June 2025 (Chainalysis).
Turkey ranks 14th in the Chainalysis 2025 index, with lira inflation hedging driving stablecoin use at both retail and institutional scale. Jordan ranks fourth in the population-adjusted ranking (Chainalysis).
Europe: Regulatory clarity leading, retail adoption lagging
Europe received over $2.6 trillion in crypto value in the 12 months to June 2025, up 42% (Chainalysis), but shows lower retail adoption rates than Asia and Latin America. Ukraine tops the population-adjusted Chainalysis rankings, with wartime economic conditions driving stablecoin savings preservation and cross-border transfers for both civilians and humanitarian organizations.
MiCA's July 1, 2026 enforcement has created a two-tier stablecoin market, with USDC, EURC, and USDG retaining regulated exchange access while USDT is excluded.
North America: Institutional and regulatory leader, not grassroots leader
The United States ranks second in the Chainalysis 2025 index as the top developed market, but adoption is driven by institutional infrastructure rather than grassroots retail usage. North America received over $2.2 trillion in crypto value in the 12 months to June 2025, up 49% (Chainalysis).
The OCC national trust bank charter wave, the GENIUS Act framework, and Circle's Circle National Trust represent the most sophisticated regulated stablecoin infrastructure in the world. Canada is developing regulatory alignment alongside the US GENIUS Act framework.
Key Drivers and Use Cases by Region
Inflation hedging and currency substitution is the most powerful and consistent driver globally.
Citizens in high-inflation countries demonstrably shift savings from local currency to USDT at rates that correlate with inflation severity. Argentina, Venezuela, Turkey, Nigeria, and Pakistan are the clearest examples.
As covered in our stablecoin infrastructure landscape guide, Bitso in Latin America and Yellow Card in Africa serve as the primary stablecoin infrastructure operating systems for inflation-driven adoption in each region.
Cross-border remittances represent the second largest driver. Latin American, South and Southeast Asian, and African diaspora remittance corridors are all seeing growing stablecoin penetration, and McKinsey and Artemis put global payroll and remittance stablecoin payments at $90 billion in 2025 (CoinDesk).
Survey work across Brazil, India, Indonesia, Nigeria and Turkey has found remittances among the leading reasons people use stablecoins.
High traditional remittance costs create a structural cost advantage for low-fee stablecoin rails that incumbent money transfer operators struggle to compete away.
B2B is the largest real payment category: McKinsey and Artemis estimated $226 billion in B2B stablecoin payments in 2025 (CoinDesk). USDT settles China-Vietnam trade, USDC settles US-Mexico B2B invoices, and RLUSD is targeting African B2B through Ripple's Flutterwave investment.
As covered in our stablecoin LATAM API guide, Latin American institutions are among the most active users of stablecoins for cross-border payments.
Financial access for the unbanked represents the structural long-term driver, since a large share of adults worldwide still lack a bank account.
Mobile-first stablecoin wallets in Sub-Saharan Africa and Southeast Asia are the first financial product accessible without a bank account for a meaningful portion of that population.
USDT on Tron's low transfer costs are a key reason it dominates in these markets, because small remittances only make sense when fees are a small share of the amount sent.
Institutional treasury and settlement is the fastest-growing segment by value in developed markets. Corporate treasury stablecoin allocation, tokenized asset settlement, and cross-border corporate payments are moving from pilot to production in Q3 2026.
Hyundai Card's USDT-on-Avalanche remittance test between US and Mexico subsidiaries, the JCB-Circle USDC MOU in Japan, and Mastercard's settlement integration with RLUSD and USDG across eight blockchain networks are all production-grade institutional adoption signals.
Data Insights, Market Structure, and Measurement Challenges
Raw stablecoin transaction volume is a deeply unreliable standalone adoption metric. McKinsey and Artemis found that only about 1% of 2025 on-chain stablecoin volume reflected real-world payments, with the rest tied to trading, internal transfers and protocol-level activity (CoinDesk).
As covered in our Allium Stablecoins Report 2026 analysis, the most significant structural signal in stablecoin data is rising velocity: monthly stablecoin velocity has been rising since early 2024, meaning each dollar of stablecoin supply is being used more frequently, which indicates genuine infrastructure maturity rather than supply inflation.
The USDT versus USDC geographic split is the most commercially important structural characteristic of the stablecoin market.
USDT on Tron has the highest active wallet count of any stablecoin on any blockchain, concentrated in emerging market retail users in Asia, Latin America, and Africa making frequent small transfers.
USDC is concentrated in institutional DeFi, corporate treasury, and regulated exchange settlement in developed markets. The two stablecoins are not competing for the same users in the same markets.
The off-chain stablecoin measurement gap means any on-chain adoption index understates true adoption. A significant portion of global USDT activity occurs through Binance's internal ledger without touching the blockchain. The true global stablecoin adoption figure is materially higher than any on-chain measurement alone captures.
The population-adjusted versus absolute-volume ranking debate has no single correct answer. Chainalysis's PPP weighting is right if the goal is measuring grassroots economic utility per capita. A raw volume ranking is right if the goal is measuring commercial infrastructure significance.
Credible adoption analysis requires both dimensions simultaneously, which is why triangulating across Chainalysis index rankings, Artemis adjusted volume, CoinDesk timezone flows, and Triple-A ownership surveys produces more accurate regional pictures than any single source.

Conclusion
The global stablecoin adoption map in 2026 is the inverse of what most observers expect.
The countries where stablecoins matter most for daily financial life are not the US, UK, or Germany: they are India, Nigeria, Argentina, Vietnam, Turkey, and Ukraine, where dollar-pegged tokens are solving inflation, remittances, and banking access problems that no domestic financial system has been able to fix at scale.
APAC led regional growth at 69% in the 12 months to June 2025, Latin America followed at 63% and Sub-Saharan Africa at 52% (Chainalysis), with India, Vietnam, and Pakistan all ranking ahead of most developed nations.
The US leads on institutional infrastructure depth, regulatory clarity, and the compliance architecture that the GENIUS Act and OCC bank charter wave are cementing as the global standard.
As the stablecoin adoption curve in Africa and Latin America accelerates through institutional infrastructure from Yellow Card, dLocal, Flutterwave, and Bitso, the gap between the countries where stablecoins are most economically necessary and the countries where they are most institutionally credentialed will continue narrowing throughout H2 2026.
Read Next
- Stablecoins in Latin America: Why Argentina and Brazil Are Going All-In
- Top Stablecoins by Active Wallets in 2026
- Yellow Card Review 2026: Africa's Stablecoin Infrastructure Operating System
FAQ:
1. Which country has the highest stablecoin adoption in 2026?
India ranks first in the Chainalysis 2025 Global Crypto Adoption Index and topped all four sub-indices, while Ukraine leads the population-adjusted ranking (Chainalysis).
2. What is the Global Stablecoin Adoption Index?
The Global Stablecoin Adoption Index is a composite measure of real-economy stablecoin usage by country and region, built from on-chain value received weighted by purchasing power parity per capita, timezone-based stablecoin flow allocation, ownership surveys, and adjusted volume filters that remove exchange flows to isolate genuine payments and savings activity.
3. Which region has the highest stablecoin adoption growth in 2026?
APAC was the fastest-growing region in the 12 months to June 2025 at 69%, followed by Latin America at 63% and Sub-Saharan Africa at 52% (Chainalysis).
4. What is the difference between USDT and USDC adoption by region?
The difference between USDT and USDC adoption by region is that USDT dominates emerging market retail, peer-to-peer, and remittance flows in Asia, Africa, and Latin America and held about 59% of stablecoin supply on October 8, 2026 (DefiLlama), while USDC leads in developed market institutional and DeFi flows in the US, EU, and Japan.
5. Why do emerging markets have higher stablecoin adoption than developed countries?
Emerging markets have higher stablecoin adoption than developed countries because citizens use dollar-pegged stablecoins to preserve purchasing power against inflation, send remittances at a fraction of traditional costs, and access financial services without a bank account through mobile wallets, solving three problems simultaneously that developed market populations do not face.
6. How much of stablecoin volume represents genuine payments?
Only a small share. McKinsey and Artemis estimated about $390 billion of genuine stablecoin payments in 2025, roughly 1% of the more than $35 trillion moved on-chain, because the majority is exchange trading, internal transfers and protocol-level activity rather than real-economy transfers (CoinDesk).
7. What is driving stablecoin adoption in Latin America in 2026?
Stablecoin adoption in Latin America in 2026 is driven by chronic currency inflation making USDT the primary savings vehicle in Argentina and Venezuela, a large remittance market where stablecoin rails cost a fraction of traditional fees, and Brazil's Pix infrastructure creating frictionless fiat-to-stablecoin conversion at scale.
8. What does the Chainalysis Global Crypto Adoption Index measure for stablecoins?
The Chainalysis index measures stablecoin adoption by weighting on-chain value received by purchasing power parity-adjusted GDP per capita and population, so a transfer in Lagos counts for more than the same amount between US institutional desks, which is why India, Nigeria, and Pakistan rank above most developed nations.
Disclaimer:
This content is provided for informational and educational purposes only and does not constitute financial, investment, legal, or tax advice; no material herein should be interpreted as a recommendation, endorsement, or solicitation to buy or sell any financial instrument, and readers should conduct their own independent research or consult a qualified professional.
Join the official Coincamps community:
Telegram: https://t.me/coin_camps
Recommended
Desk: Brent Crude Tops $110, Musk's Net Worth Drops 528.6 Billion in Four Days After Tesla Roadster Launch
Oct 17, 21:49
JST Fifth Buyback and Burn Successfully Concludes: Over 170 Million Tokens Worth Approximately $23.53 Million Burned, Buyback Mechanism Set for Comprehensive Upgrade
Oct 17, 20:10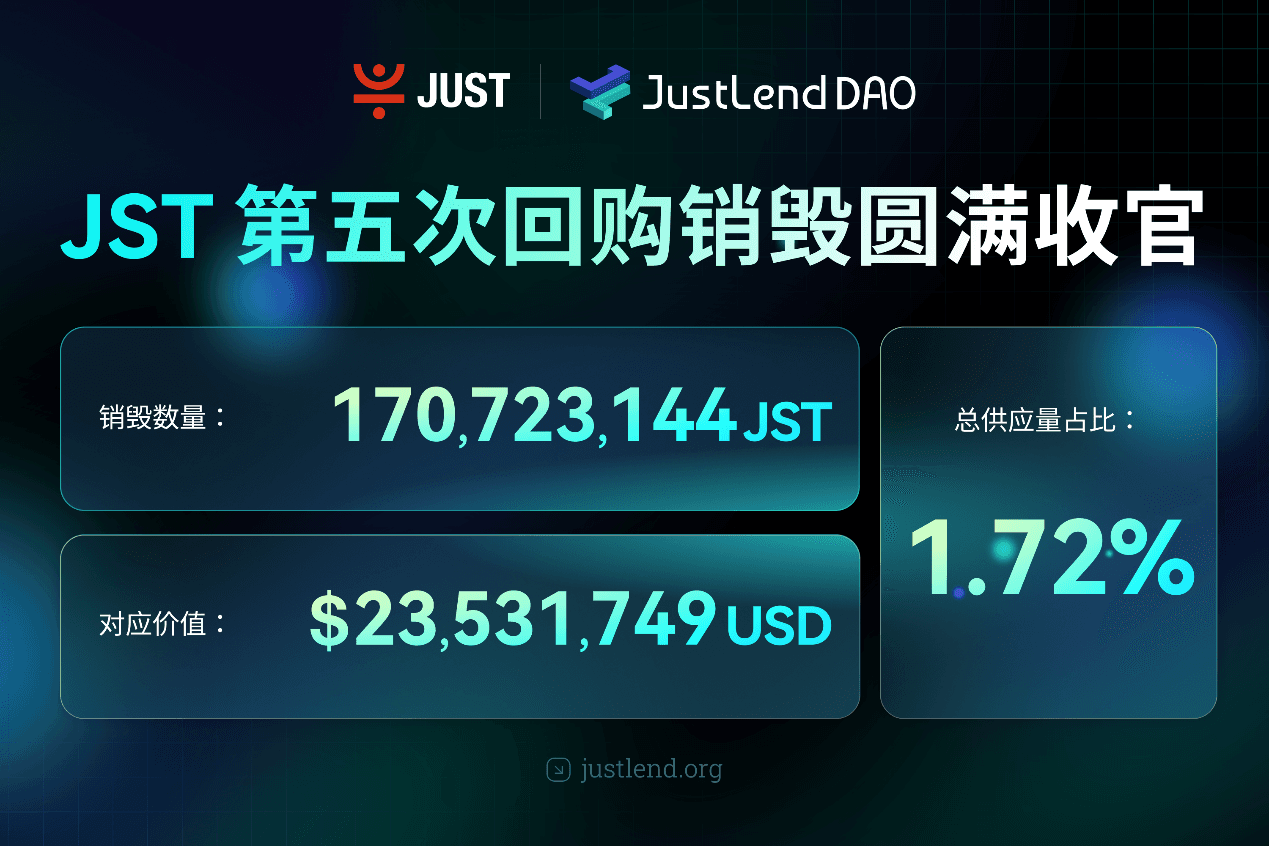
BitTorrent Brand Upgrade and Initial BTT Buyback & Burn Launch Simultaneously, Dual Engines Usher in New Era of Web3 Infrastructure
Oct 17, 20:00
Asia Market Daily: Japan's BOJ signals more rate hikes while Korea targets offshore perpetual platforms (2026/10/17)
Oct 17, 17:01Why did Papertrade backfire on you?
Oct 17, 17:01
The 'Strict Father' of Northern Myanmar: This Company Deploys 200,000 "AI Best Actors" to Strike Back Against Scammers
Oct 17, 15:34