Week 21 on-chain data: Market sentiment is optimistic after Ethereum ETF is approved, and it is expected to fluctuate upward this week

Original title: "ETH's 196-4 document approved, ETF approval imminent, what are the capital movements in the market? | WTR 5.27"
Original source: WTR Research Institute
This week from May 20 to May 27, the highest price of Bingtang Orange was around $71979, the lowest price was close to $67969, and the fluctuation range reached about 7%.
Observing the chip distribution chart, there are a large number of chips traded around 65000, which will have a certain support or pressure.
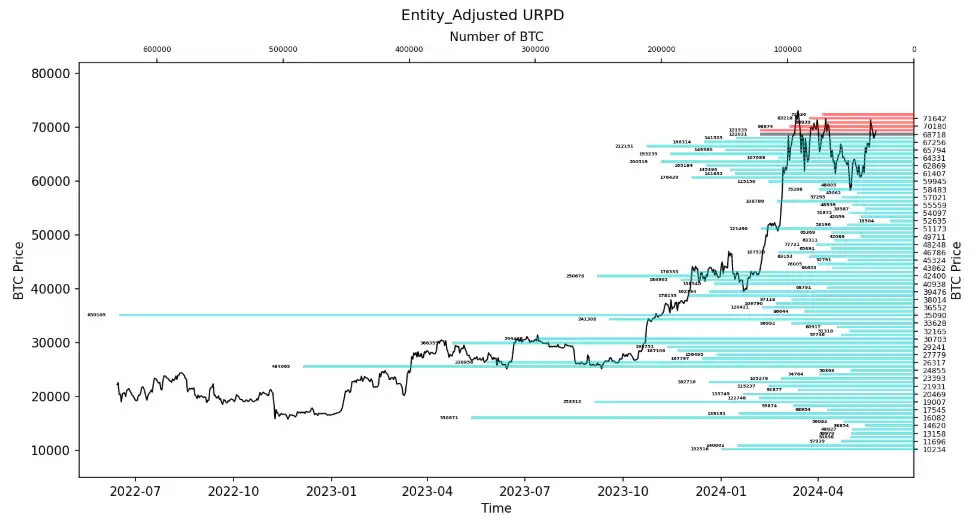
• Analysis:
1. 59000-63000 is about 980,000 pieces;
2. 64000-68000 is about 1.08 million pieces;
• The probability of not falling below 57000~61000 in the short term is 82%;
• The probability of not rising below 71000~74000 in the short term is 67%.
Economic news
1. JPMorgan Chase said: The strong performance of Nvidia, the darling of artificial intelligence, and the steady economic growth mean that the S&P 500 index may have room for further growth.
2. Bank of America data showed that $10.5 billion flowed into the U.S. stock market in the past week; cryptocurrency funds attracted the fifth largest inflow of funds on record, reaching $1.4 billion.
3. Waller, the hot candidate for the next head of the Federal Reserve, believes that the possibility of re-acceleration of inflation can be ruled out. If the data supports it, it may consider cutting interest rates at the end of the year. The idea of only cutting interest rates once does not make much sense. The April inflation data shows that progress toward the 2% target may have resumed. The lack of inflation acceleration is a reassuring signal.
Crypto Ecosystem News
1. The U.S. House of Representatives voted for the first time on the 21st Century Financial Innovation and Technology Act (FIT21), which aims to reshape the regulatory landscape of digital assets, give the Commodity Futures Trading Commission (CFTC) greater power in the digital asset spot market, and create new jurisdiction boundaries for the Securities and Exchange Commission (SEC).
2. Grayscale ETH Trust (ETHE) had a trading volume of $687 million on the 21st, a record high since May 21. The previous high was $842 million on May 19, 2021.
3. Nick Forster, founder of Lyra and former Wall Street options trader, said that the options market shows that the probability of ETH reaching $5,000 by June 28 is about 20%, and the probability of exceeding $5,500 by July 26 is also 20%.
4. Nasdaq documents show that BlackRock submitted a revised 19B-4 form for the ETH spot ETF, which will exclude ETH pledge. Bitwise submitted a revised 196-4 form and plans to launch an ETH ETF on the New York Stock Exchange (NYSE).
5. Gary Gensle, director of the U.S. Securities and Exchange Commission (SEC), reiterated that the cryptocurrency market is full of fraud, that there are "serious conflicts of interest" among various cryptocurrency trading platforms, and that the cryptocurrency market needs "referees on the field."
6. Cointelegraphresearch said that industry observers said that the U.S. Securities and Exchange Commission (SEC) approved the spot ETH ETF, indicating that it recognizes that ETH is a non-security type.
7. The U.S. Securities and Exchange Commission (SEC) approved the 196-4 documents of 8 spot ETH ETFs on Friday. An SEC spokesperson said that the agency would not comment on anything other than the spot ETH ETF approval order.
8. ETH spot ETF listing requires approval of both 196-4 and S-1, and is currently waiting for the approval of the S-1 document. ETF issuer VanEck has submitted the revised S-1 application document for the spot ETH ETF as soon as possible.
9. Bloomberg ETF analyst James Seyffart said that the S-1 approval of the ETH spot ETF may be completed in "a few weeks", and the process usually takes up to five months.
10. ETF analyst Eric Balchunas said that mid-June is definitely possible, and it is expected that there will be only one round of comments on the S-1 amendment document, similar to the feedback provided by the SEC to spot BTC ETF applicants. This process takes about two weeks
Long-term insights: used to observe our long-term situation; bull market/bear market/structural changes/neutral state
Medium-term exploration: used to analyze what stage we are in, how long will this stage last, and what situation we will face
Short-term observation: used to analyze short-term market conditions; and the possibility of some directions and certain events occurring under certain premises
• BTC net inflow/outflow distribution on different exchanges
• Large inflow and outflow net positions on exchanges
• Different long-term holders’ position structures
• Total chip distribution structure on the chain
(BTC in the figure below) Net inflow/outflow distribution on different exchanges)
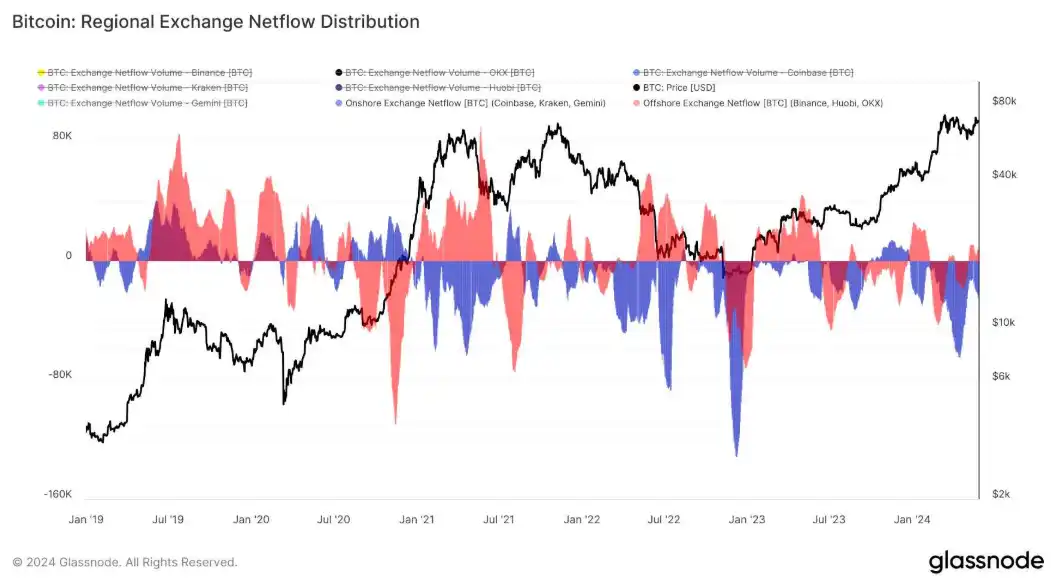
Near the recent price high, the net outflow on US exchanges did not drop significantly, indicating that long-term investors in the market are still confident in the current price and are not in a hurry to sell.
The increase in net inflows to offshore exchanges means that they are the main source of short-term pressure on the market.
(Figure below: Large inflow and outflow net positions of exchanges)
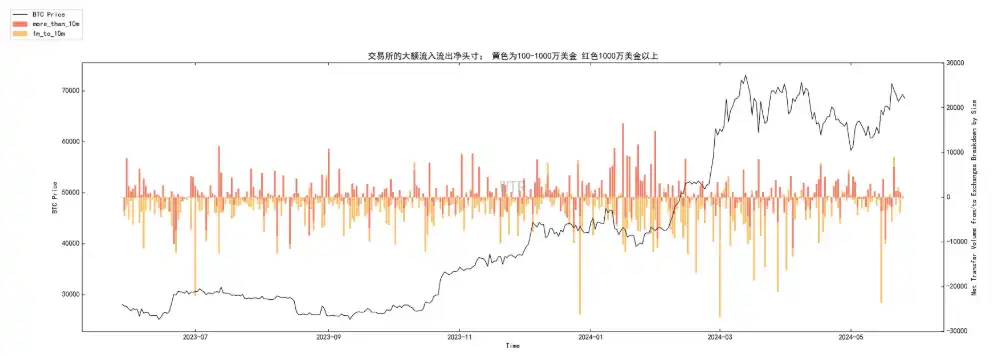
Recently, as prices have risen, large net positions (more than $10 million) have shown a clear net inflow trend at high levels, indicating that large holders are gradually selling BTC for profit.
Smaller net positions (1-10 million US dollars) show a certain net outflow trend, but the amplitude is small. Relatively positive.
(Figure below: Different long-term holders' holding structure)
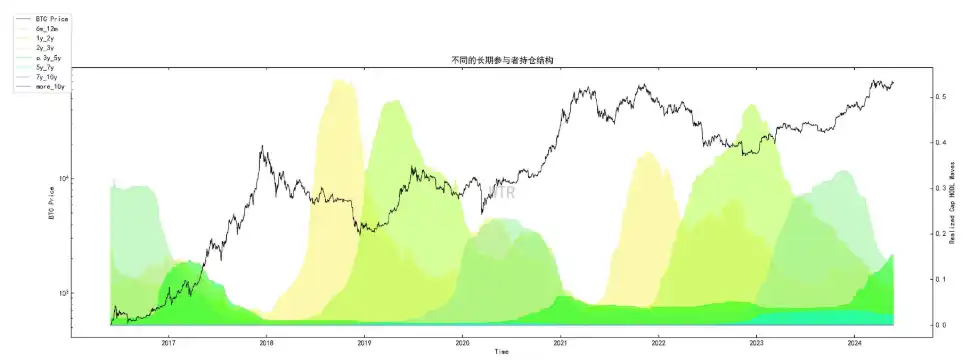
Recently, as prices have risen, the proportion of BTC holdings held between 3 and 5 years has increased, indicating that long-term investors who buy are increasing their holdings of assets.
The holding ratio of long-term holders (more than 2 years) is relatively stable, indicating that these long-term holders have a high tolerance for the current market volatility and have not seen large-scale selling.
(Figure below: Total chip distribution structure on the chain)
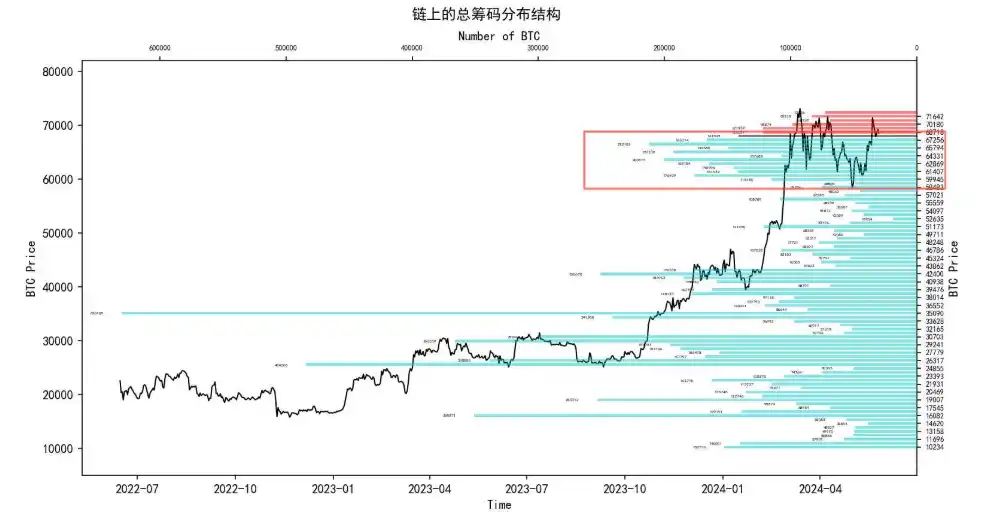
A large amount of Bitcoin has accumulated in the price range below $60,000, indicating that in the previous market correction, a large amount of BTC was purchased by holders at a lower price range and held for a long time.
There is a certain amount of selling pressure in the range above 70,000 or 71500. If the price continues to rise in the short term, it may encounter resistance in these areas.
Market Outlook
Pressure and Opportunity:
The net inflow of large holders indicates that there is a certain amount of selling pressure in the short term, which may suppress the price in the short term.
Especially in the price range above $70,000, there is a certain amount of selling pressure.
The increase in net inflows in offshore exchanges indicates that the market has a certain pressure on prices around $70,000. The US exchanges show buying at relatively low points.
3-5 year market participants have become the backbone of support, ensuring the stability of the market.
Those who are more conservative need to pay attention to the movements of large holders and the market's ability to take on the market, and adjust their positions to cope with short-term fluctuations if necessary.
And whether to invest some funds above 70000-71000 to smooth the risk of fluctuations.
• Accumulation trend points
• Whale exchange net position
• 1-6 month realized profit ratio
• 6 month realized profit ratio
• Network sentiment positivity
• ETH exchange trend net position
(Accumulation trend below)
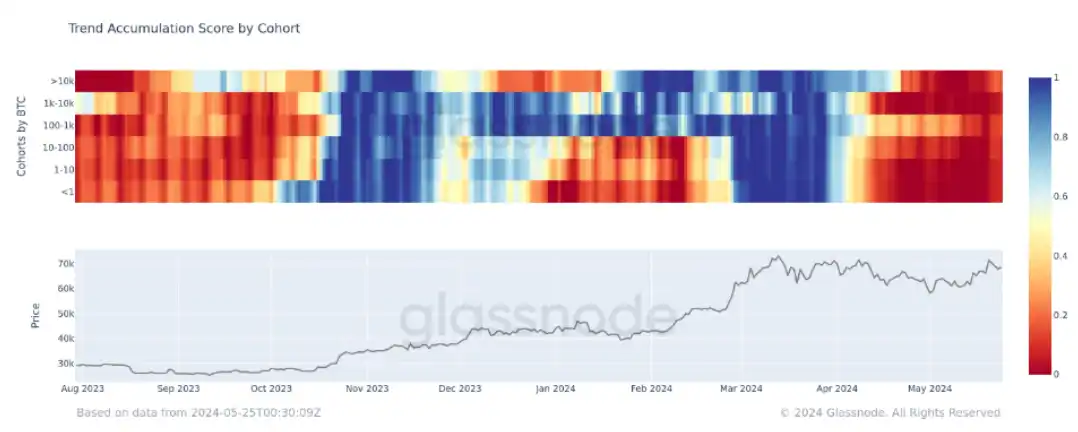
The accumulation situation in the market has eased slightly, and the overall situation has eased slightly from the poor accumulation state.
It may take time to repair the real accumulation state, and the market still has a certain degree of caution.
(Net position of whale exchanges below)
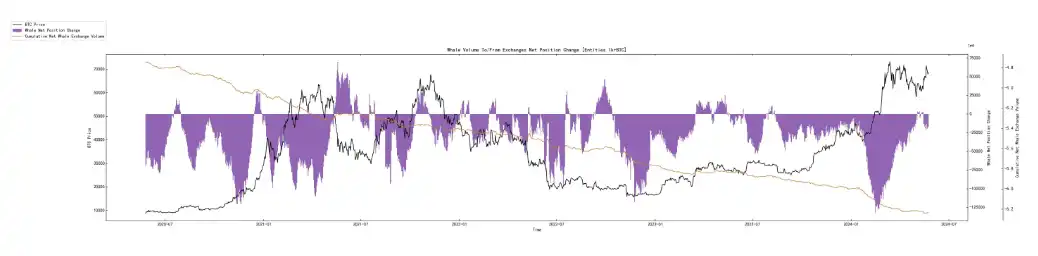
The outflow of whales from exchanges has slightly weakened, and some whales may be in a mild wait-and-see situation.
(Realized profit and loss ratio in January-June below)
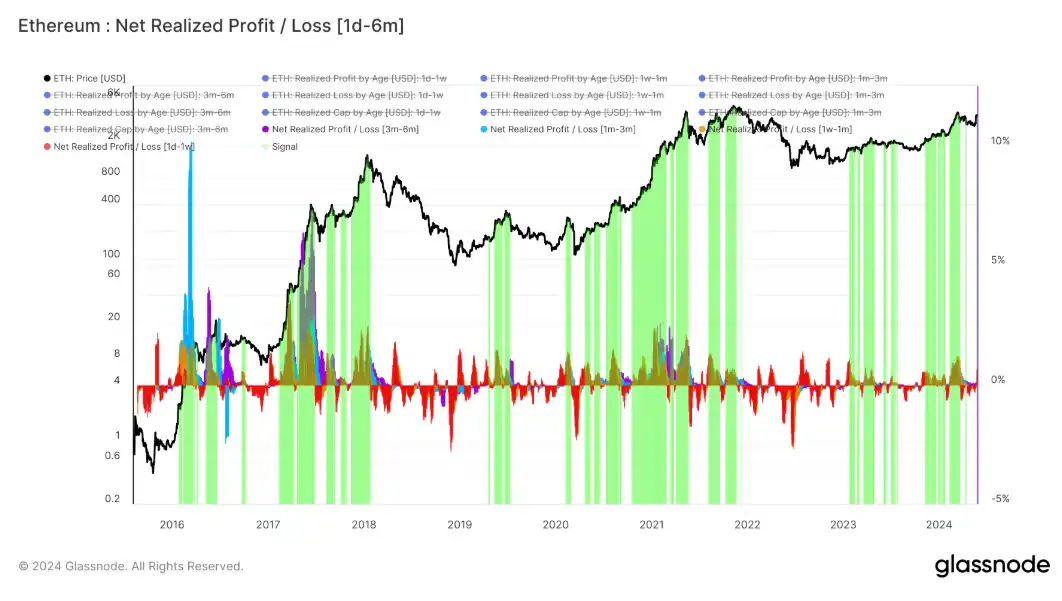
The profit and loss ratio is calculated as follows:
The net realized profit/loss indicator calculates the percentage of net profit or loss of all mobile coins in the respective age groups.
The selling situation of each age group can be analyzed through the profit and loss dynamics.
Green area: When the profit and loss ratio of participants from 1 day to 6 months is on the rise, it will be displayed in green.
Currently, ETH is at a high profit and loss ratio stage and is in an upward zone, and may need incremental funds to promote it.
Otherwise, excessive profit selling may cause the market to be unable to take it up, and it may face the dilemma of insufficient momentum to rise.
(Network sentiment positivity in the figure below)
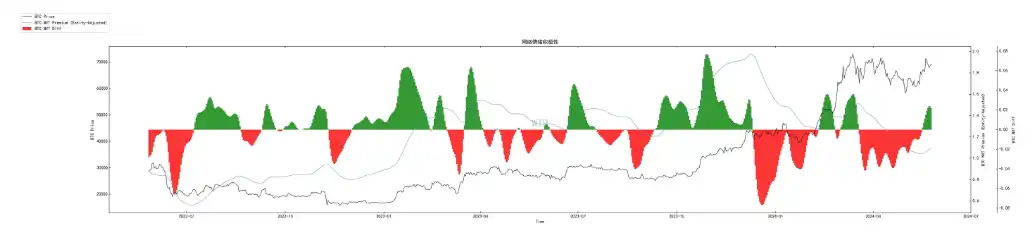
Currently, the network sentiment is still high, but the growth rate has slowed down slightly.
The pace of the market may become slightly slower.
The slowdown in growth continues, and there may be a period of consolidation.
(ETH exchange trend net position in the figure below)
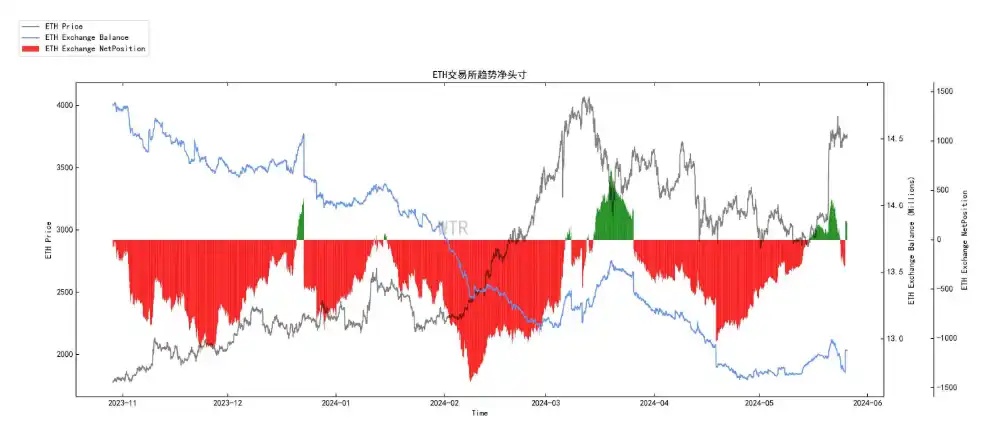
ETH's exchange trend net position shows that a certain amount of ETH is charged to the exchange, which may form potential selling pressure, or the behavior of whales consolidating their wallets.
It is necessary to pay attention to the volatility risk in the short term, and the market may be affected by potential pressure.
• Derivatives risk factor
• Option intention transaction ratio
• Derivatives trading volume
• Option implied volatility
• Profit and loss transfer volume
• New addresses and active addresses
• Bingtangcheng Exchange net position
• Yitai Exchange net position
• High-weight selling pressure
• Global purchasing power status
• Stablecoin exchange net position
• Off-chain exchange data
Derivatives rating: The risk factor is in the neutral area. Derivatives risk is moderate.
(Figure below: Derivatives risk factor)

ETH's ETF news has had a greater impact on the market recently, so this week we will observe ETH's derivatives risk factor. After the market rose last week, the risk factor was close to the red area, and in the short term it was close to the market high. The current risk factor is below the neutral area, and there is not much room for sustained short squeeze this week, and it may be more inclined to fluctuate upward.
(Figure below: Options intention transaction ratio)
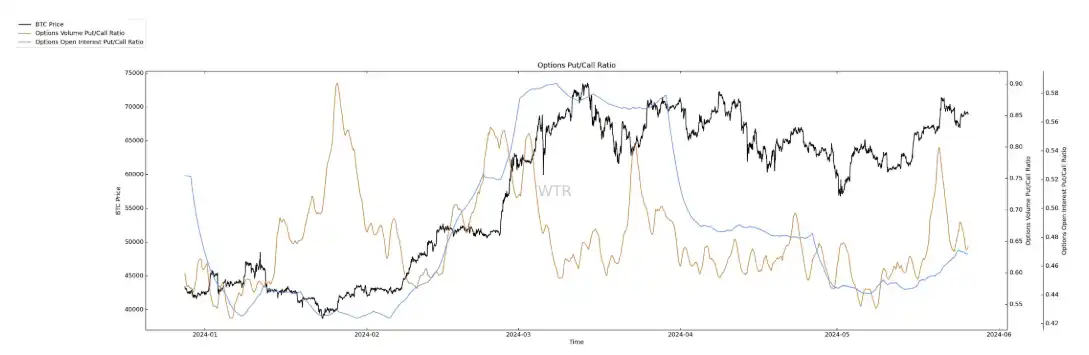
Option trading volume has dropped slightly, and the proportion of put options is in the middle.
(Figure below: Derivatives trading volume)
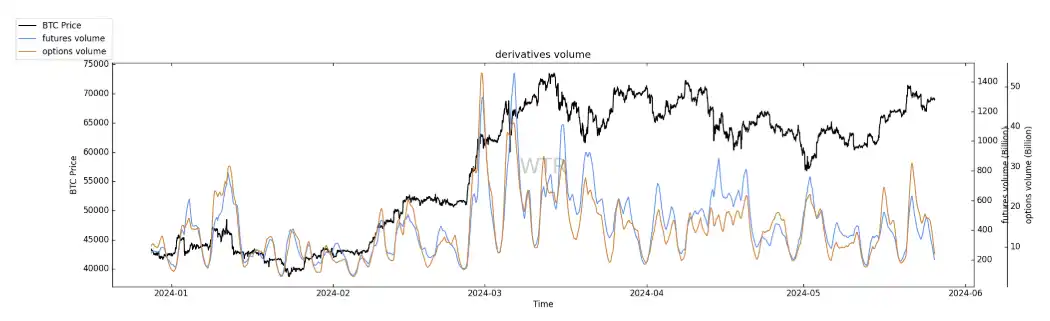
Derivatives trading volume is at a low level.
(The figure below shows the implied volatility of options)
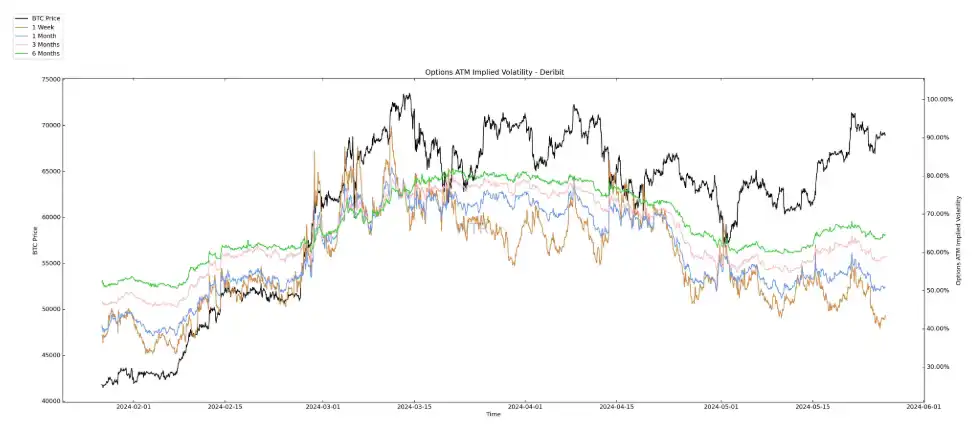
The implied volatility has dropped slightly.
Sentiment rating: neutral
(The figure below shows the profit and loss transfer)
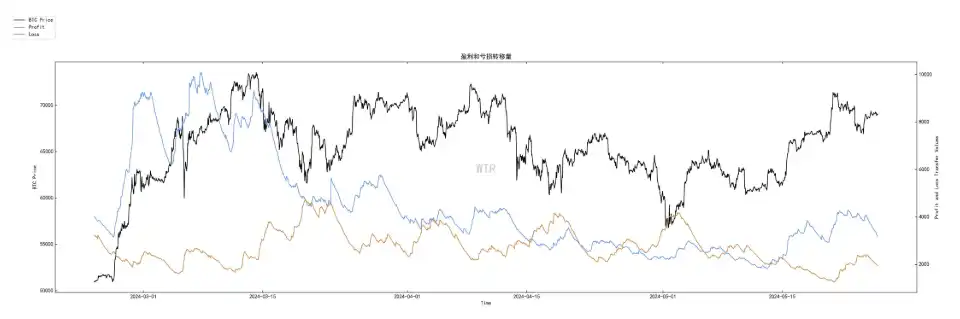
Although the market rose sharply last week, the current market positive sentiment and panic sentiment are at a relatively low level. Market sentiment is still at a relatively neutral level, and the cost of short-term holders has not risen rapidly at present, and is still around 61K. This week, it is expected to focus on observing the positive sentiment indicator (blue line). If it continues to decline, the market is more inclined to fluctuate.
(The figure below shows the new addresses and active addresses)
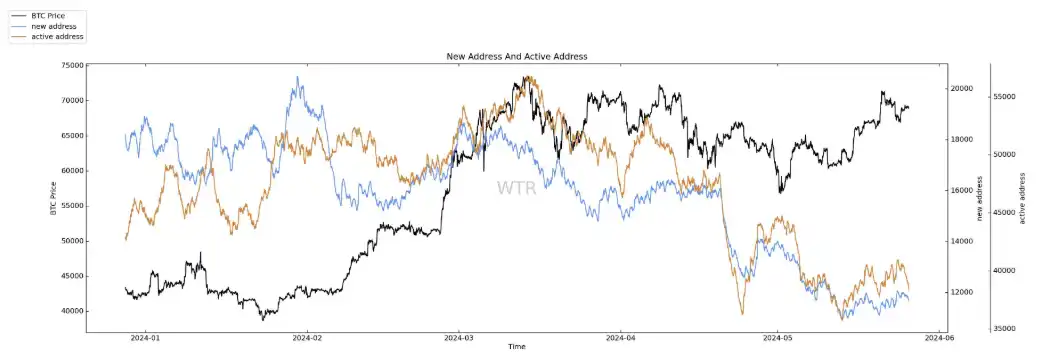
The new and active addresses are at a low level.
Spot and selling pressure structure rating: Overall, there is a small inflow and a small amount of selling pressure.
(The net position of Bingtangcheng Exchange in the figure below)
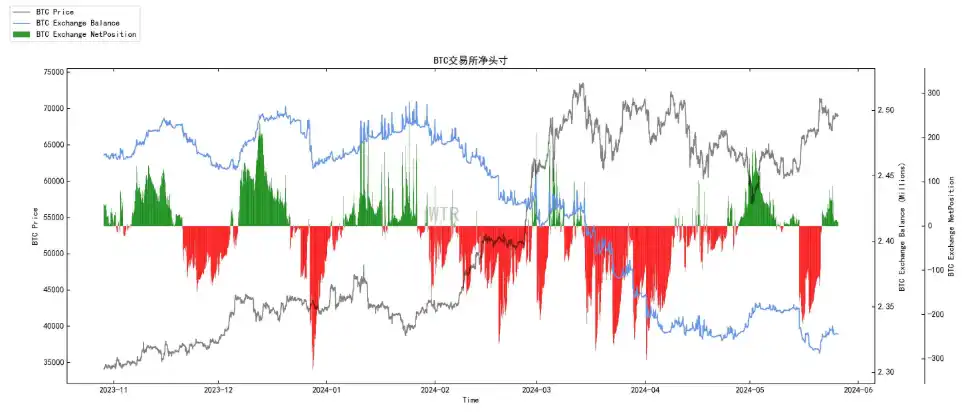
The net position of BTC Exchange is in a small inflow state.
(The net position of E-Tai Exchange in the figure below)
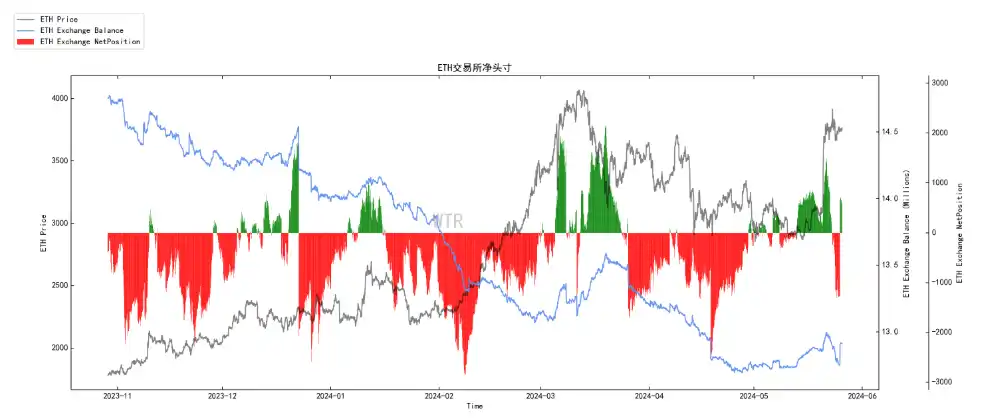
The net position of ETH Exchange is in a small inflow state.
(The high-weight selling pressure in the figure below)
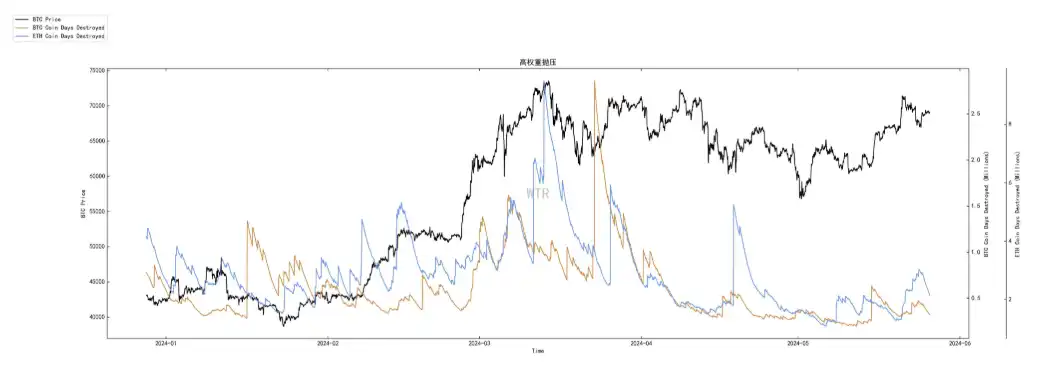
No high-weight selling pressure.
Purchasing power rating: Global purchasing power has recovered slightly, and stablecoin purchasing power is basically flat.
(Global purchasing power status in the figure below)
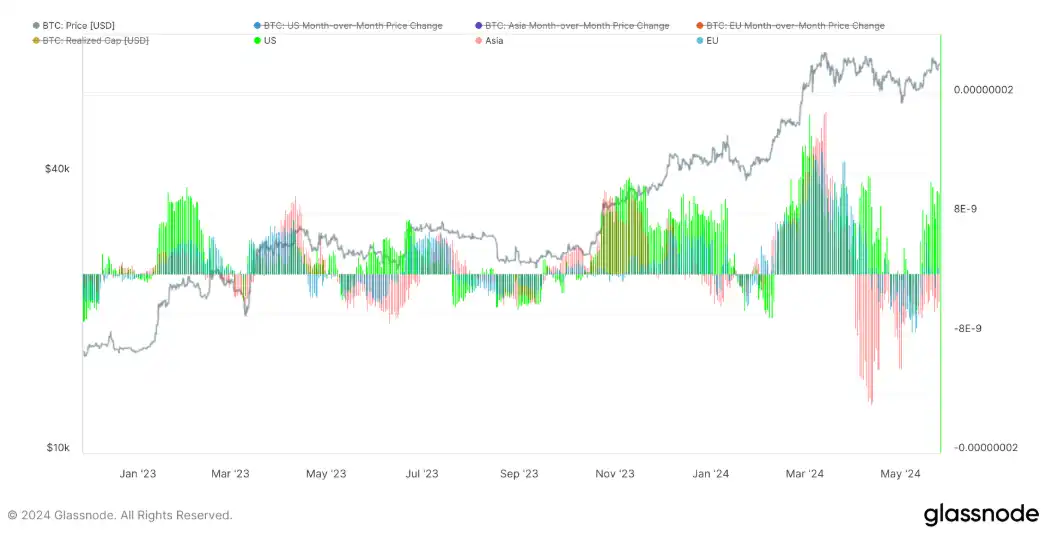
Consistent with last week, the current purchasing power in the Americas has recovered slightly, but the purchasing power in Asia and Europe is still in a state of loss. But overall, the purchasing power in the Americas is dominant.
(USDT exchange net position in the figure below)
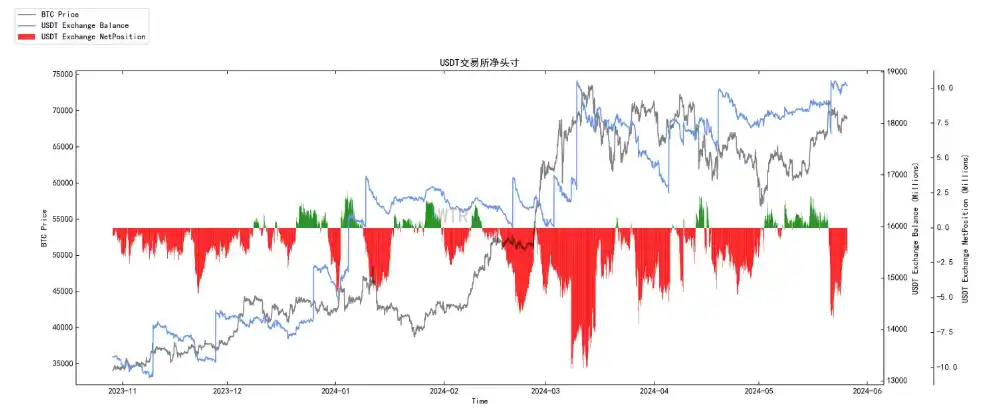
USDT net position is flat overall.
Off-chain transaction data rating: There is a willingness to buy at 65,000; there is a willingness to sell at 71,000.
(The following is the Coinbase off-chain data)
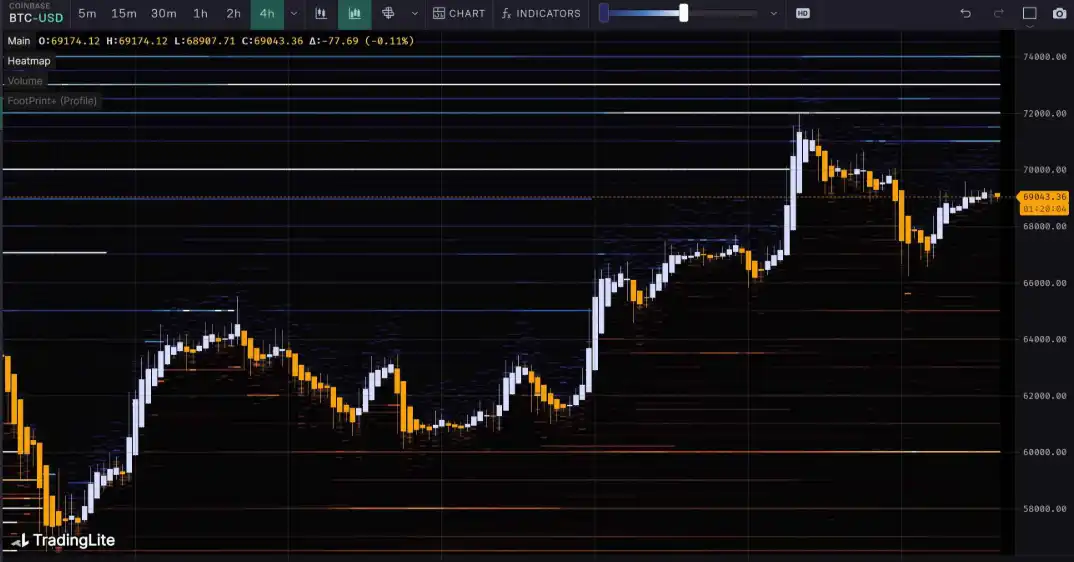
There is a willingness to buy at prices around 60000 and 65000;
There is a willingness to sell at prices around 71000, 72000, and 73000.
(The following is the Binance off-chain data)
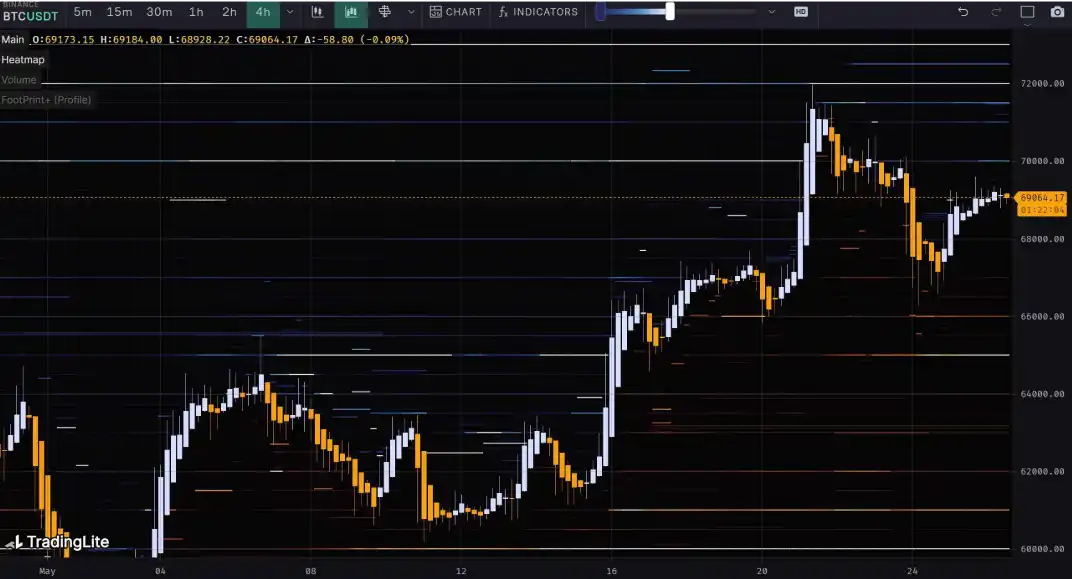
There is a willingness to buy at prices around 60000, 61000, and 65000;
There is a willingness to sell at prices around 71000, 72000, and 73000.
(Bitfinex off-chain data in the figure below)
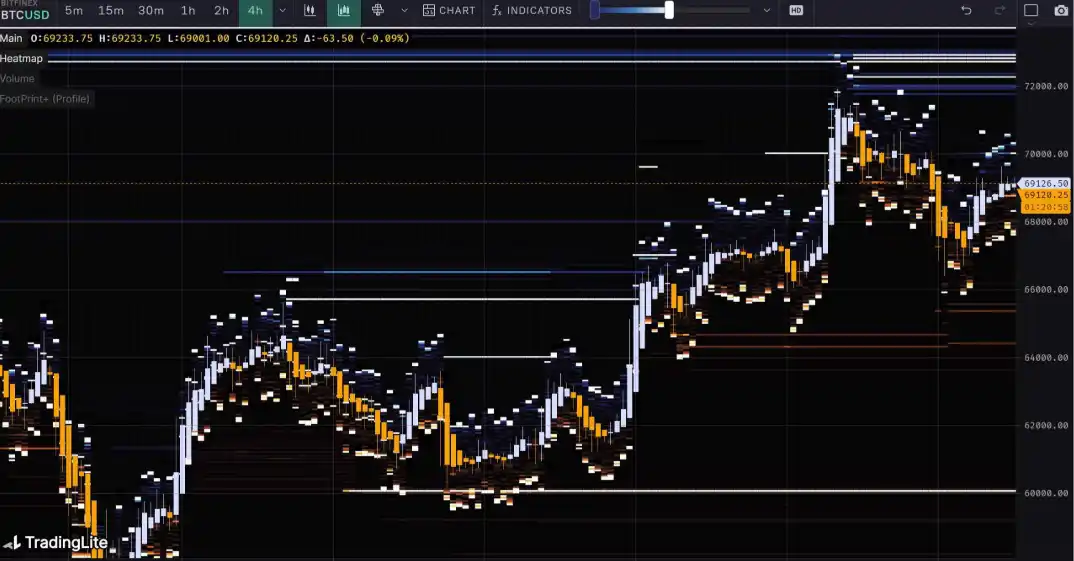
There is a willingness to buy at prices around 60,000 and 65,000;
There is a willingness to sell at prices around 71,000, 72,000 and 73,000.
Summary of news:
1. The market is better than expected in the medium term; the 196-4 documents of 8 spot ETH ETFs were approved suddenly and slightly unexpectedly, followed by the approval of the S-1 document.
2. The sudden approval of the document may have an impact; next, market makers will purchase a certain amount of ETH spot to supplement liquidity.
3. The fastest speed for the approval of the remaining s-1 documents is about two weeks, that is, there is only one round of comments and feedback corrections. If it is slow, it may take about 5 months.
4. There may be a certain amount of capital inflow and institutional allocation before and after the listing of ETH ETF.
5. Next, the crypto narrative will be interspersed with the main line of ETH ETF approval in the medium term, and then the main tone of the narrative will be interest rate cuts, which is much better than the expected single main line, that is, only "interest rate cuts" and "halving".
Because the statistical icons show that September and October are generally relatively sluggish periods for US stocks. If you follow the US stock market completely, the market may become relatively depressed and dull in the medium term. In the long run, once the Fed is easing, it is difficult for the crypto market to directly enter a long-term sluggish deep bear, which is another relatively optimistic news and expected changes in the long run.
Long-term insights on the chain:
1. US exchanges bought at the low point of the correction, while Asian exchanges are currently the main selling force;
2. At present, above 70,000, there will be large participants selling;
3. Investors with 3-5 years of experience continue to support the market, and investors with more than 2 years of experience have not changed much at present, and the market structure is relatively stable;
4. The distribution of chips below 60,000 is relatively dense, and there is accumulation, which is a good price range.
• Market tone:
Market sentiment is still optimistic, and support is firm.
On-chain mid-term exploration:
1. The accumulation trend in the market is weak;
2. The whales may be in a mild wait-and-see stage;
3. The market needs incremental funds to break through the stock dilemma;
4. The sentiment on the chain is slightly slowing down;
5. There is a certain amount of ETH stagnation in the exchange, so be cautious.
• Market tone:
Slowdown
The pace of the market slows down, the accumulation is weak, and the growth rate of the enthusiasm on the chain slows down.
On-chain short-term observation:
1. The risk factor is in the neutral area, and the risk is moderate.
2. The number of newly added active addresses is at a low level.
3. Market sentiment status rating: neutral.
4. The net position of the exchange as a whole shows a small inflow state, and the selling pressure is general.
5. Global purchasing power rebounded slightly, and the purchasing power of stablecoins remained basically the same.
6. Off-chain transaction data showed that there was a willingness to buy at 65,000; there was a willingness to sell at 71,000.
7. The probability of not falling below 57,000~61,000 in the short term is 82%; among them, the probability of not rising below 71,000~74,000 in the short term is 67%.
• Market tone:
The overall market sentiment is in a neutral position, and the purchasing power is basically the same as last week. A small amount of selling pressure has begun to appear. The overall expectation is that there will be less room for continued large-scale short squeezes this week, and it is more inclined to fluctuate upward. The probability of a large-scale decline in the market is still extremely low.
Risk warning:
The above are all market discussions and explorations, and do not have directional opinions on investment; please be cautious and prevent market black swan risks.
Recommended
The Wall Street Journal: How is AI Trading Stealing the Limelight from Cryptocurrency?
Aug 15, 14:00
Tencent Still Has a Dream
Aug 15, 11:27
To Catch North Korean Hackers, They Set Up a Fake Project
Aug 15, 10:00
From Litigation to Settlement: Positive Signal Released by HTX's Negotiation with FCA
Aug 14, 19:32
11,742 Shipping Addresses Exposed Alongside Trezor Orders
Aug 14, 19:01
Founder Interview: FOMO Creator Explains How They Added 30,000 Users in One Day and Became One of the Fastest-Growing Crypto Apps
Aug 14, 18:37