Coinbase Mid-Year Review: 10 Charts to Analyze Crypto Market Fundamentals and Technical Trends

Original title: Midyear Review: Crypto Markets in 10 Charts
Original author: David Han, Institutional Research Analyst, Coinbase
Original translation: Kate, MarsBit
In our mid-year review, we present 10 charts covering some of the key crypto market fundamentals and technical trends.
• We normalize the growth of total value locked (TVL) by the price appreciation of the native gas token on the top Layer 1 (L1) and Layer 2 (L2) networks.
• We isolate the impact of CME futures underlying trading on ETF flows, showing that the growth of unhedged exposure to BTC ETFs has slowed significantly since early April.
In our mid-year review, we provide 10 charts covering some of the key crypto market fundamentals and technical trends. We normalize the growth of Total Value Locked (TVL) by the price appreciation of the native gas tokens on the top Layer 1 (L1) and Layer 2 (L2) networks. We also take a relative approach, measuring the impulse of on-chain activity in these networks through total transaction fees and active addresses, and then specifically break down the biggest drivers of Ethereum transaction fees. After that, we look at on-chain supply dynamics, correlations, and the current state of liquidity in crypto spot and futures markets.
In addition, a more closely tracked indicator in the crypto space is the inflows and outflows of the US Bitcoin spot ETF, which is often seen as an indicator of changes in demand for cryptocurrencies. However, the growth of CME Bitcoin futures open interest (OI) to date suggests that some of the inflows into the ETF since launch have been driven by basis trading. We isolate the impact of CME futures basis trading, showing that the growth of unhedged exposure to BTC ETFs has slowed substantially since early April.
Growth in TVL
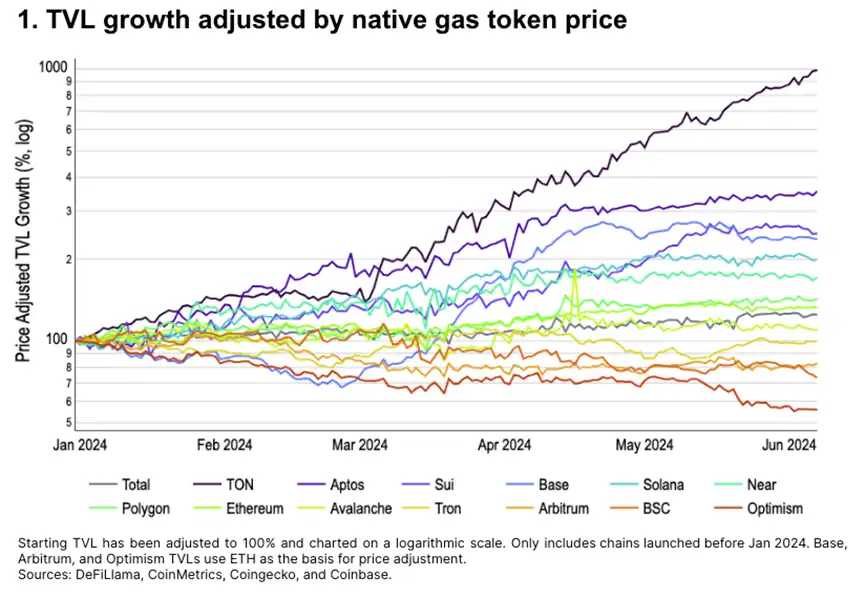
Rather than comparing raw TVL across chains, we track TVL growth through the price appreciation of their native gas tokens. Typically, native tokens make up a large portion of TVL in an ecosystem due to collateral or liquidity usage. Adjusting TVL growth by price growth helps distinguish how much of TVL growth is from net new value creation versus pure price appreciation.
Overall, TVL grew faster than total crypto market cap, up 24% year-over-year. The fastest-growing chains — TON, Aptos, Sui, and Base — can all be considered relatively nascent and benefiting from a rapid growth phase.
Activity Driving: Fees and Users
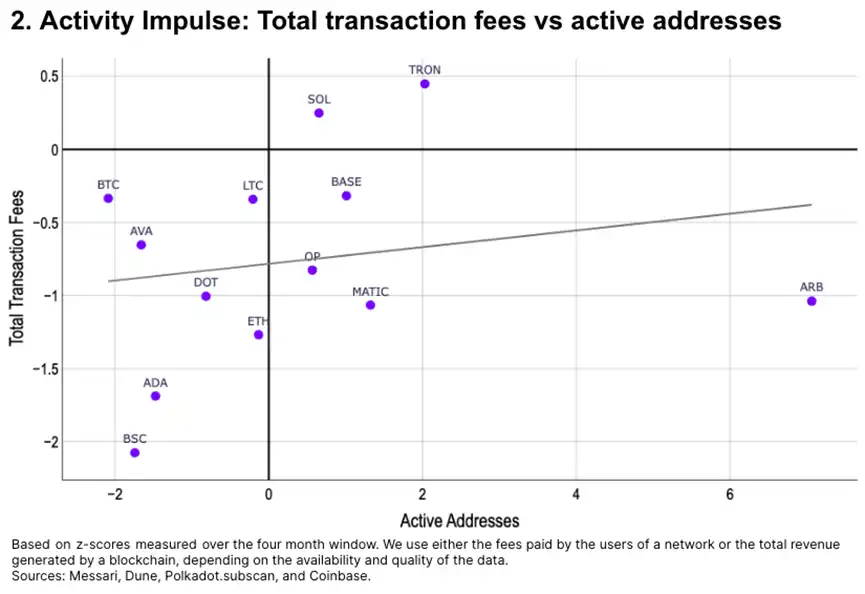
We compared each network’s (1) average daily active addresses in May with its (2) average daily fees or revenue in the same period, both measured as standard deviations compared to the prior four months (Jan-Apr). It shows:
• On-chain fees generally fell in May, except for Solana and Tron
• Active addresses on Ethereum L2 (particularly Arbitrum) grew significantly due to fee reductions after EIP-4844
• Fees on Cardano and Binance Smart Chain fell below the decline in wallet activity
Transaction Fee Drivers
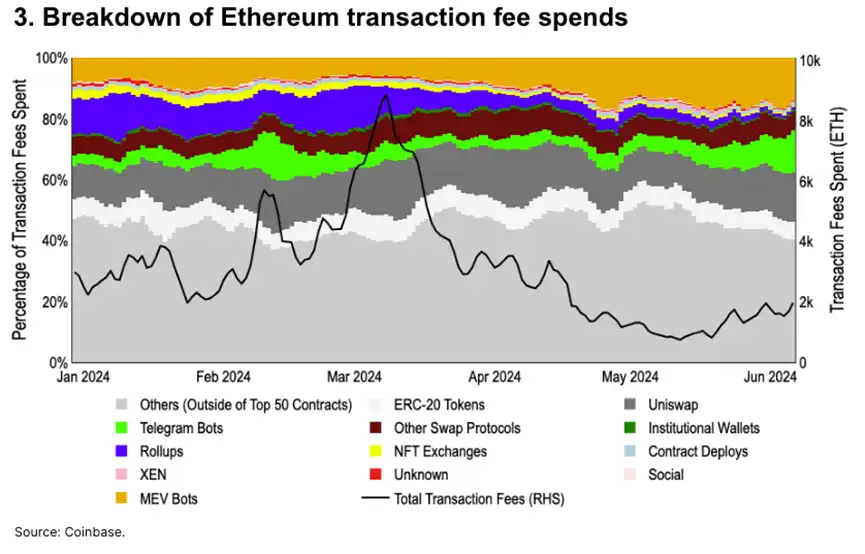
A breakdown of fees for Ethereum’s top 50 contracts. Together, these contracts account for over 55% of total gas consumption YTD.
After the Dencun upgrade in March, rollup spending has gradually decreased from 12% of mainnet fees to less than 1%. MEV (maximum extractable value) driven transaction fees increased from 8% to 14%, and direct transaction fees increased from 20% to 36%. Although ETH has seen inflation since mid-April, we believe the return of market volatility (and high-value transaction demand) may offset this trend.
Ethereum L2 Growth
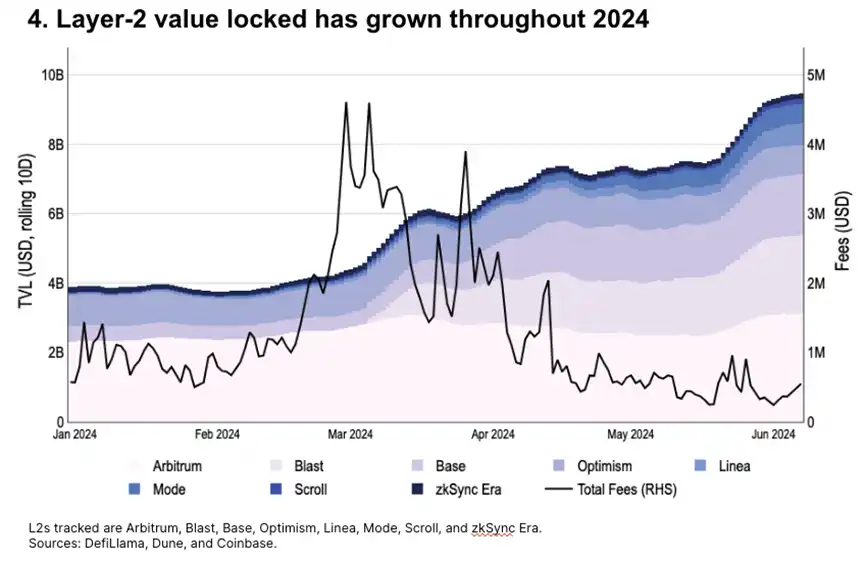
Ethereum L2 TVL increased 2.4x year-on-year, with total L2 TVL of $9.4 billion as of the end of May. As of early June, Base currently accounts for about 19% of total L2 TVL, second only to Arbitrum (33%) and Blast (24%).
Meanwhile, following the launch of blob storage in the March 13 Dencun upgrade, total transaction fees have dropped significantly, even though TVL (and transaction counts on many chains) are at all-time highs.
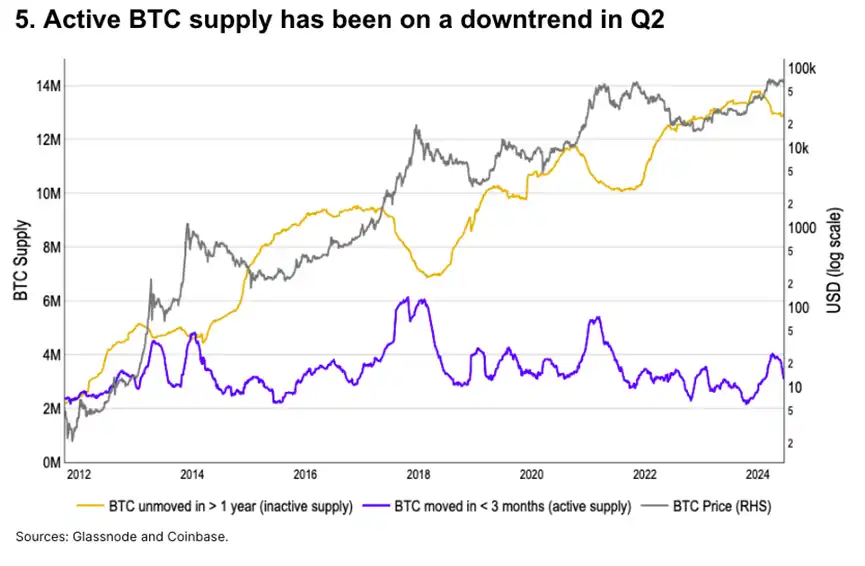
Bitcoin Active Supply Change
The decline in active Bitcoin supply, which we define as Bitcoin moved in the past 3 months, has historically lagged local price peaks, indicating a slowdown in market volume. Active Bitcoin supply reached a local peak of 4M Bitcoin in early April, its highest level since 1H21, before falling to 3.1M Bitcoin in early June.
At the same time, however, BTC’s inactive supply, i.e., BTC that has not moved in over 1 year, has remained flat year-to-date. We believe this suggests that recent market optimism has faded, although long-term cyclical investors are still paying attention.
Correlations
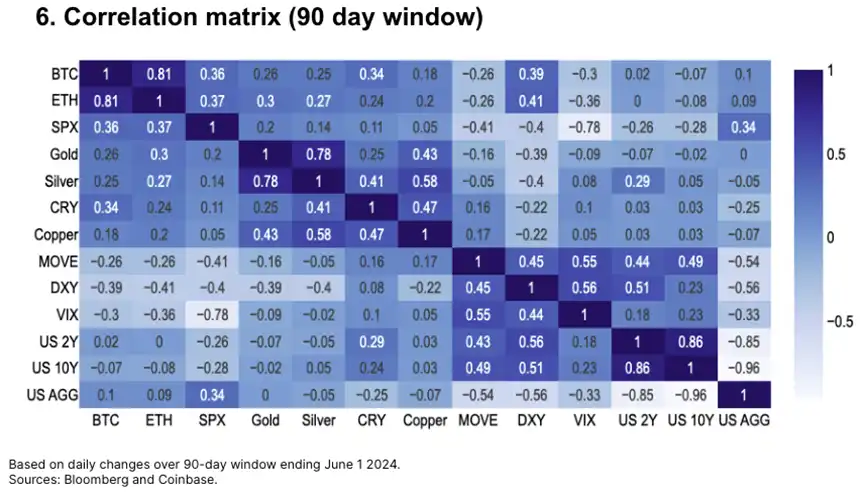
Based on a 90-day window, Bitcoin's returns appear to be modestly correlated with daily changes in a number of key macroeconomic factors. This includes U.S. equities, commodities, and the multilateral dollar index, although the positive correlation with gold remains relatively weak.
Meanwhile, the correlation between Ethereum and the S&P 500 (0.37) is nearly identical to the correlation between Bitcoin and the S&P 500 (0.36). Crypto pairs continue to trade with high correlations compared to the cross-sector, although the BTC/ETH correlation has declined slightly to 0.81 from a peak of 0.85 in March-April
Increasing Market Liquidity
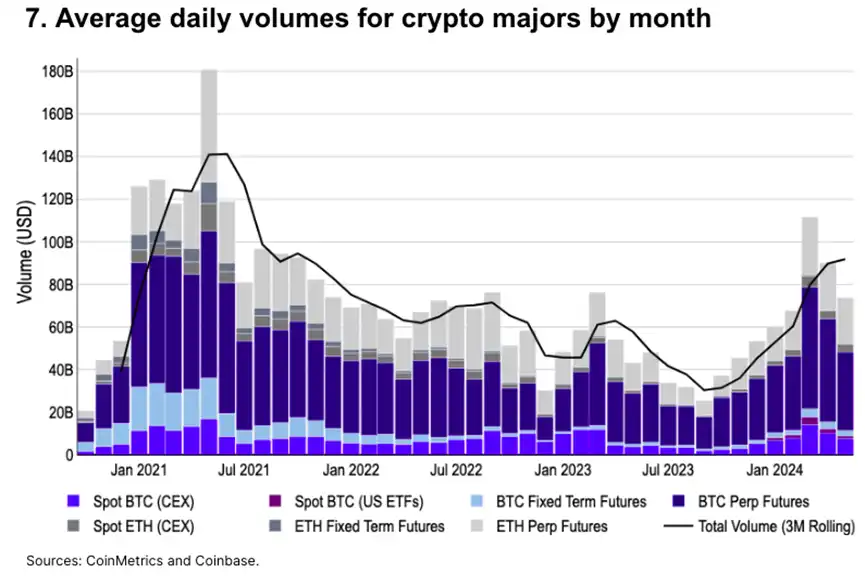
Total daily spot and futures volume for Bitcoin and Ethereum is down 34% from its peak of $111.5 billion in March 2024. Still, May’s sales ($74.6 billion) were higher than any month since September 2022, except for March 2023.
Spot Bitcoin volumes also increased significantly following the approval of a U.S. spot Bitcoin ETF in January, with spot centralized exchange (CEX) Bitcoin volumes in May up 50% from December ($7.6 billion vs. $5.1 billion). In May, spot Bitcoin ETF trading volume was $1.2 billion, accounting for 14% of global spot trading volume.
CME Bitcoin Futures
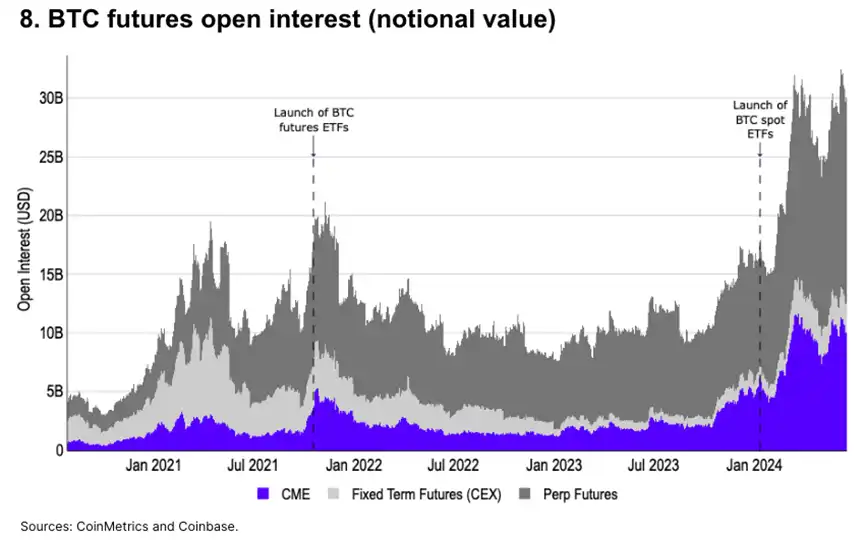
CME open interest has increased 2.2x since the beginning of 2024 (from $4.5 billion to $9.7 billion) and 8.1x since the beginning of 2023 (to $1.2 billion). We believe that most of the new money flows YTD can be attributed to basis trades following the approval of spot ETFs. Following their launch, Bitcoin basis trades can now be completed entirely through traditional securities brokers in the United States.
Perpetual open interest also increased from $9.8 billion to $16.6 billion, with the proportion of CME open interest remaining around 30% (29-32%) throughout the year. That being said, CME futures' market share has increased significantly from 16% at the beginning of 2023, indicating an increase in interest from onshore US institutions.
CME Ethereum Futures
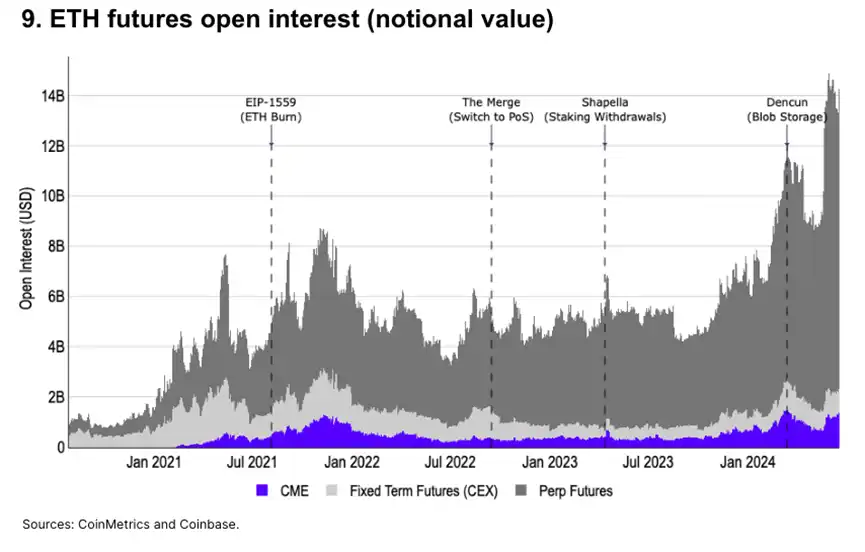
CME ETH futures open interest is near all-time highs. However, ETH open interest is still dominated by perpetual futures contracts, which are only available in certain non-US jurisdictions. As of June 1, 85% ($12.1 billion) of total open interest was in futures trading, while CME futures accounted for only 8% ($1.1 billion).
The impact of endogenous ETH catalysts on open interest is often visible, with the last major spike in open interest following the US approval of a spot ETH ETF (19b-4 filing). Prior to that, the Dencun upgrade on March 13 saw open interest peak.
Alternatively, traditional fixed-term futures on centralized exchanges remain popular, with open interest comparable to CME futures.
Isolating CME Bitcoin Basis Trades
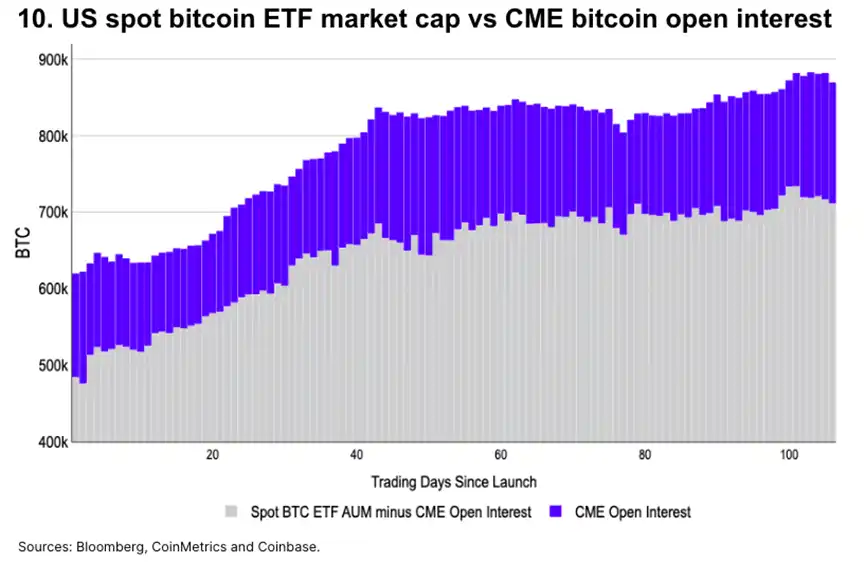
Normalizing the total spot ETF market cap against CME Bitcoin open interest shows that the majority of spot ETF flows can be attributed to basis trades since early April (day 55).
After the spot ETF was approved, ETF custody of Bitcoin increased by about 200k BTC as of March 13th (day 43). This suggests that Bitcoin was bought directionally during this time, which in part explains the price increase during that time. Since then, ETF custody of Bitcoin has remained between 825-850k until the end of May when it strongly broke out of this range.
Original link
Recommended
The Wall Street Journal: How is AI Trading Stealing the Limelight from Cryptocurrency?
Aug 15, 14:00
Tencent Still Has a Dream
Aug 15, 11:27
To Catch North Korean Hackers, They Set Up a Fake Project
Aug 15, 10:00
From Litigation to Settlement: Positive Signal Released by HTX's Negotiation with FCA
Aug 14, 19:32
11,742 Shipping Addresses Exposed Alongside Trezor Orders
Aug 14, 19:01
Founder Interview: FOMO Creator Explains How They Added 30,000 Users in One Day and Became One of the Fastest-Growing Crypto Apps
Aug 14, 18:37