How to Perfectly Time the Market Bottom? Focus on These 7 Key Indicators

Original Article Title: "Market Reversal Coming? Checking 7 Bitcoin Bottom Indicators"
Original Article Author: Viee, Biteye
What stage is the market at now? Is the market bullish or bearish? Is it still possible to buy the dip? Feeling panicked about the drop, is the bull market still intact?
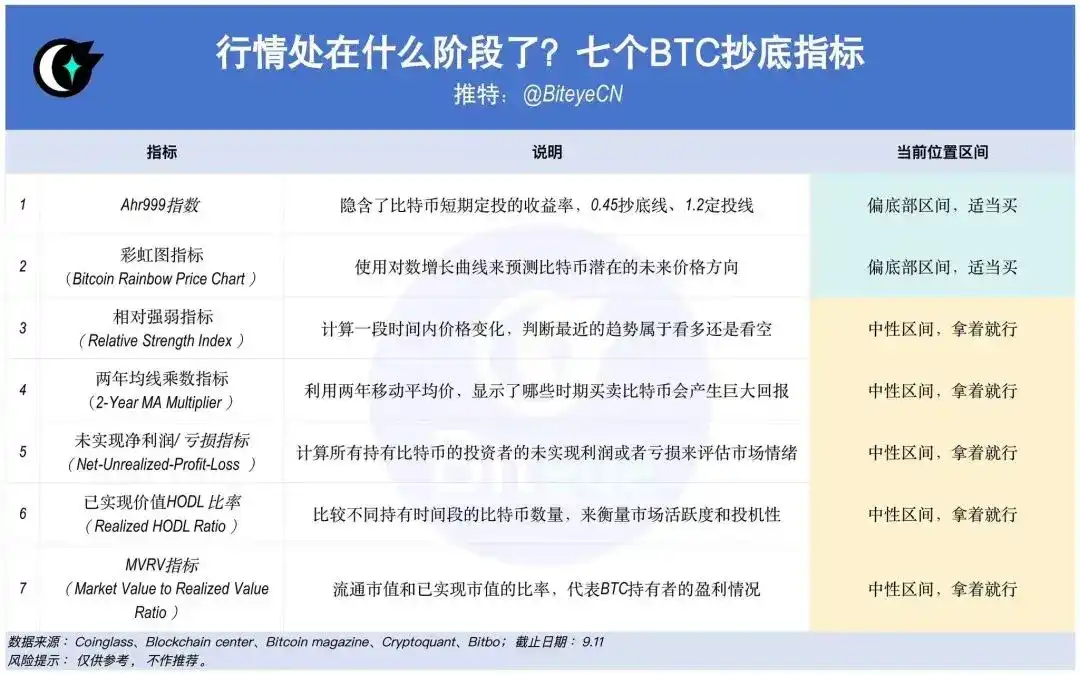
To better analyze the current trend, Biteye has compiled 7 BTC bottom indicators.
Helping you assess market sentiment and price fluctuations from multiple perspectives!
01 Ahr999 Index
· Current Value: 0.6, in the dollar-cost averaging range
· Interpretation: The index implies the short-term dollar-cost averaging return of Bitcoin and the deviation of Bitcoin's price from its expected valuation.
0.45 Bottom Line, 1.2 DCA Line
· When AHR999 Index < 0.45, the indicator will suggest buying the dip
· When AHR999 Index is between 0.45-1.2, the indicator will suggest buying for dollar-cost averaging
· When AHR999 Index > 1.2, the price is relatively high, not suitable for trading
Trend Review: Starting from mid-April, the index oscillated around 1.2, broke below 1.2 since June, entering the dollar-cost averaging range, steadily approaching the 0.45 bottom line in the past three months.
02 Rainbow Chart Indicator (Bitcoin Rainbow Price Chart)
· Current Value: In a relatively cool market range, suitable for buying
· Interpretation: Uses a logarithmic growth curve to predict Bitcoin's potential future price direction. There are a total of 10 color bands, with warmer colors above indicating an overheated market, a good selling point; cooler colors represent a subdued market sentiment, a good buying point.
· Trend Review: Bitcoin's price has mostly been in the cooler color range so far this year, not yet reaching an overheated market, making the current price suitable for buying.
03 Relative Strength Index (RSI)
· Current Value: 58.41, not yet in the buy zone
· Interpretation: The RSI indicator calculates price changes over a period of time to determine whether the recent trend is bullish or bearish. The score is evaluated relative to the previous 12 months.
High RSI implies very positive price momentum compared to the previous 12 months
Low RSI implies very negative price momentum compared to the previous 12 months
RSI > 70: Bitcoin overbought, may soon undergo a correction, can be a sell signal
RSI < 30: Bitcoin oversold, may see a reversal to the upside, can be a buying opportunity
· Trend Review: Historically, the RSI indicator has not dropped below 30. When referencing this indicator, one can consider the closer to 30, the more oversold, or the closer to 70, the more overbought.
04 2-Year MA Multiplier
· Current Value: $57,604 BTC, in a price-neutral zone
2-Year Moving Average (2YMA): 38,018
2-Year MA Multiplier (2YMA x5): 190,092
· Interpretation: Utilizes the 2 Year Moving Average line (green line) and its 5x multiplier (red line) to highlight periods where buying or selling Bitcoin would result in significant returns.
Price < 2YMA (Green Line): Price is at a historical low, indicating a buying opportunity
Price > 2YMA x5 (Red Line): Price is at a historical high, suggesting a selling point
If price is between moving averages, it is in a neutral position
· Trend Review: Currently in a neutral zone, not yet at a complete buy zone. From May 2022 to October 2023, this indicator is in the buy zone.
05 Net Unrealized Profit/Loss (NUPL) Indicator
· Current Value: 45.33%, not the best buy zone
· Interpretation: Evaluates market sentiment by calculating the unrealized profit or loss of all Bitcoin holders.
NUPL < 0: Market in Extreme Fear, Buy the Dip
NUPL 0-0.25: Slight Profit Area, also suitable for buying
NUPL 0.25-0.5: Bull/Bear Transition, gradually entering a bull market
NUPL 0.5-0.75: Strong Bull Market Sentiment
NUPL 0.75-1: Extreme Greed, Consider Taking Profits
In other words, the further NUPL is from 0, the closer the market trend is to the bottom or top.
· Trend Review: Since January 23, the market has moved away from the loss range and gradually become profitable. From February to July this year, RSI was above 0.5, indicating strong bull market sentiment. However, in the past two months, RSI has dropped to the 0.25-0.5 range, and market sentiment has also declined.
06 Realized HODL Ratio
· Current Value: 2689.22, Neutral Zone
· Interpretation: By comparing the amount of Bitcoin held for different time periods, such as short-term (within 1 month) and long-term (over 1 year) UTXO (Unspent Transaction Output) quantities, market activity and speculation are measured. A high value indicates a large number of short-term holders, reflecting a speculative market; a low value implies a high proportion of long-term holders, indicating a more stable market.
When approaching the red zone, the market is overheated, suitable for taking profits
When approaching the green zone, the coin price is relatively low, suitable for buying the dip
· Trend Review: Since January 23, the RHODL Ratio has gradually moved away from the green zone, showing an upward trend. Over the past few months, it has been in a oscillating downward trend, indicating a cooling off of market heat but has not fully entered a cooling phase.
07 MVRV Ratio (Market Value to Realized Value Ratio)
· Current Value: 1.83, Market Not in Bottom Range
· Interpretation: MVRV is a relative indicator, representing the ratio of Circulating Market Value (Market Cap, MV) to Realized Market Value (Realized Cap, RV), i.e., the ratio of BTC's total market value to the market value calculated from BTC's last active price, representing BTC holders' profitability.
MVRV > 3.5, the market is at the top, holders have significant profits and tend to sell.
MVRV < 1, the market has bottomed out, with the majority of holders at a loss, higher willingness to hold than to sell, increasing the probability of price rise.
· Trend Review: Over the past three to four months, this indicator has been in a downtrend, with holders' profits gradually decreasing. The closer it gets to the bottom range, the easier it is for the market to rebound.
Risk Disclaimer: The above is for information sharing only and not investment advice. Readers should comply with local laws and regulations.
Recommended
The Wall Street Journal: How is AI Trading Stealing the Limelight from Cryptocurrency?
Aug 15, 14:00
Tencent Still Has a Dream
Aug 15, 11:27
To Catch North Korean Hackers, They Set Up a Fake Project
Aug 15, 10:00
From Litigation to Settlement: Positive Signal Released by HTX's Negotiation with FCA
Aug 14, 19:32
11,742 Shipping Addresses Exposed Alongside Trezor Orders
Aug 14, 19:01
Founder Interview: FOMO Creator Explains How They Added 30,000 Users in One Day and Became One of the Fastest-Growing Crypto Apps
Aug 14, 18:37