Coinbase Q3 Earnings Report Analysis: Election Rally Drives Stock Price Surge, Base Continues to Lead L2

Original Title: Coinbase & Base: Financial Performance Overview
Original Author: insights 4.vc
Translation: DeepFlow Tech
During November 5th to 6th, Coinbase Global's (NASDAQ: COIN) stock price surged by 31% due to the election results, rising from $193.96 to $254.31. This report provides an in-depth analysis of Coinbase's current financial status and the performance metrics of its Layer 2 blockchain Base.
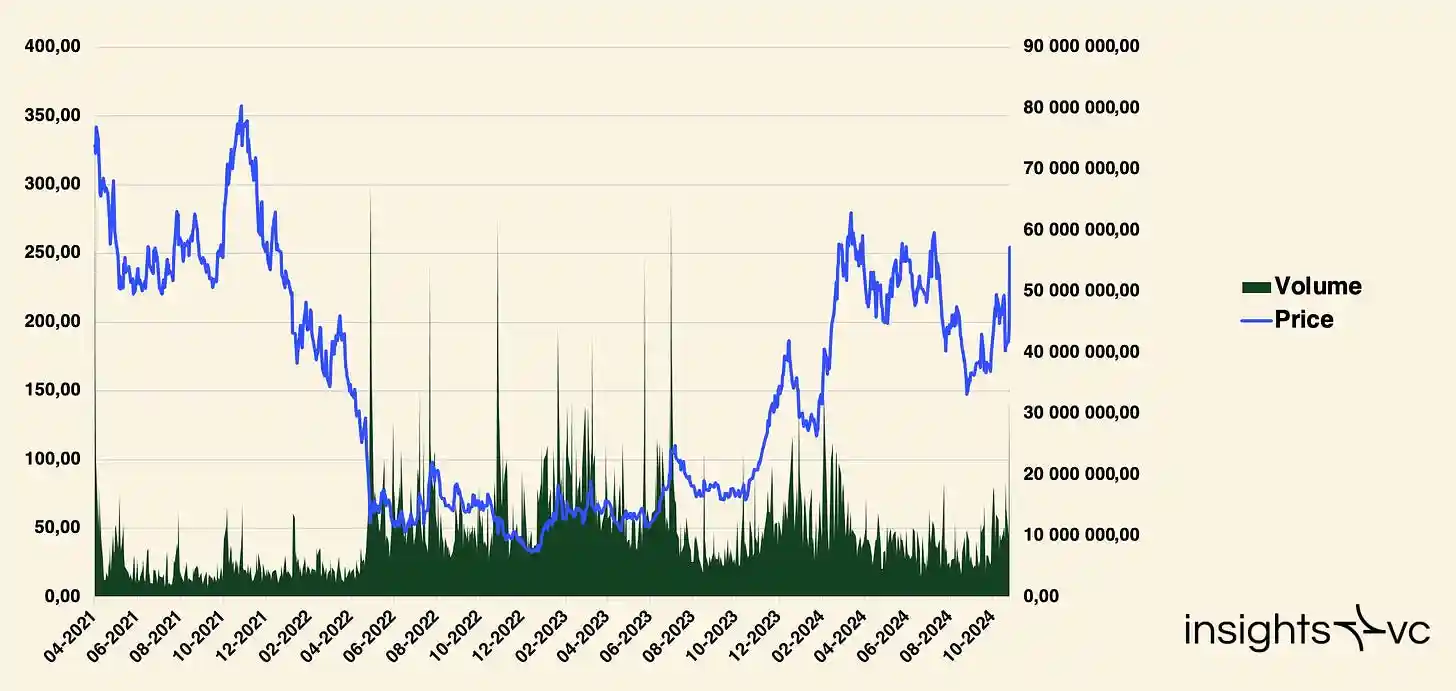
Coinbase (COIN) Closing Price: $254.31 | Trading Volume: 35.46M - November 6, 2024
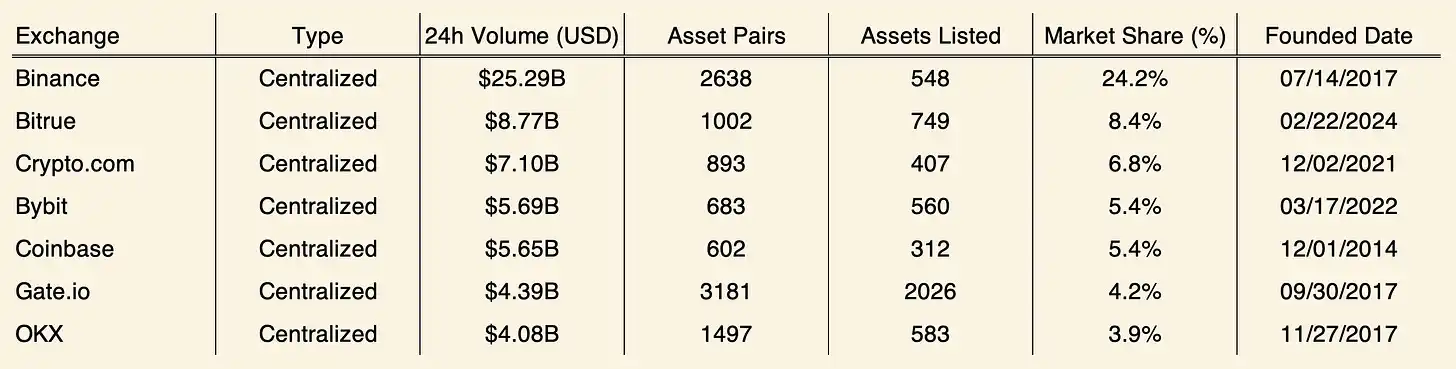
Coinbase Competitors: Key Metrics Overview
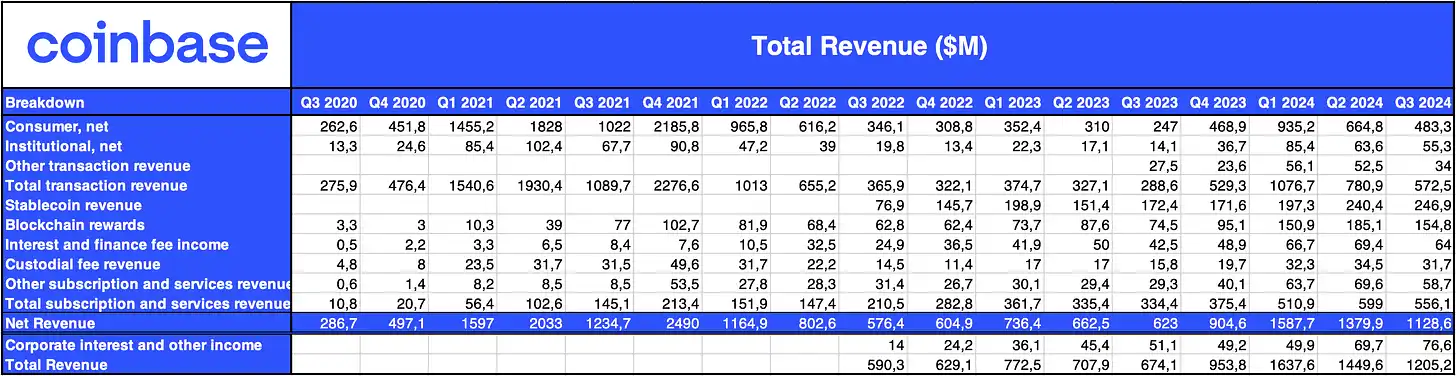
Revenue Breakdown (Q3 2020 - Q3 2024)
Revenue
· Total Revenue in Q3 2024: $12.052 billion, lower than Q2 2024's $14.496 billion but up from Q3 2023's $7.725 billion.
· Revenue Trend: After peaking in Q4 2021, total revenue has stabilized at a lower level since Q2 2022.
Revenue by Segmented Markets
· Consumer Trading: $4.833 billion in Q3 2024, down from $6.648 billion in Q2, showing sensitivity to market fluctuations but remaining a primary revenue source.
· Institutional Trading: Slightly decreased from $63.6 million in Q2 2024 to $55.3 million in Q3 2024, with minor fluctuations and a lower contribution to revenue.
· Blockchain Revenue: In the third quarter of 2024, it was $1.548 billion, lower than the second quarter's $1.851 billion, but a year-over-year increase, providing a stable income related to blockchain development.
· Stablecoin Revenue: $2.469 billion, remained stable each quarter, demonstrating Coinbase's significant role in the cryptocurrency space.
· Interest and Financial Fees: $64 million in the third quarter, still providing a stable income source despite market fluctuations.
· Subscription and Services: $5.561 billion in the third quarter, lower than the second quarter's $5.99 billion, indicating some growth in services but impacted by current market pressures.
Expense Analysis
· Transaction Fees: $1.718 billion (15% of net revenue), a 10.3% decrease from the second quarter of 2024.
· Technology and Development: $3.774 billion, a 3.6% increase compared to the previous quarter.
· Sales and Marketing: $1.648 billion, a slight 0.3% decrease.
· General and Administrative: $3.304 billion, a 3.2% increase.
· Other Operating Net Revenue: -$8.6 million, indicating the net revenue for this category.
· Total Operating Expenses: $10.357 billion, a 6.4% decrease from the second quarter of 2024.
· Total Transaction Volume in the third quarter of 2024: $1.85 trillion, lower than the second quarter of 2024's $2.26 trillion and also lower than the third quarter of 2023's $920 billion.
· Consumer Transactions: $340 billion, a slight decrease from the $370 billion in the second quarter of 2024.
· Institutional Transactions: $1.51 trillion, lower than the $1.89 trillion in the second quarter of 2024.
Asset Revenue Breakdown
· Bitcoin: Accounting for 37% of total transaction volume, higher than the 35% in the second quarter of 2024.
· Ethereum: Transaction volume stable at around 15%, indicating consistent market interest.
· Note: Solana has been highlighted as the third largest asset in the past two quarters, with its total transaction revenue share increasing from 10% to 11%.
· Other Assets: Decreased to 33% in the third quarter of 2024, reflecting diversification efforts, but the current focus remains on Bitcoin and Ethereum.
Liquidity Overview
· USDC Holdings: $5.08 billion in the third quarter of 2024, slightly lower than the $5.89 billion in the second quarter of 2024. This indicates that USDC continues to be a stable liquidity source, with a decrease possibly signaling strategic asset redeployment.
· Company Cash Held at Third-party Institutions: $92 million, slightly lower than the previous $97 million, demonstrating minimization of third-party risk.
· Money Market Funds and Government Bonds: Increased to $60.88 billion, higher than the $40.68 billion in the third quarter of 2023, indicating a conservative shift towards low-risk, highly liquid financial instruments amid market volatility.
· Company Cash: Decreased from the peak of $35.49 billion in the second quarter of 2022 to $15.44 billion, possibly due to strategic investments or operational needs.
· Total Liquidity Resources: Grew to $82.32 billion in the third quarter of 2024, demonstrating a strong financial foundation and readiness to respond to strategic opportunities or market downturns.
Investment and Financing Activities
· Operating Cash Flow: $6.87 billion in the third quarter of 2024, showing the company's strong ability and resilience to generate cash in its core business.
· Capital Expenditure: Only $19 million, reflecting a conservative approach to fixed costs to support financial flexibility.
· Strategic Investments: Outflows were relatively small, including $14 million in venture capital (Details of Coinbase Ventures' activities are available in the Google Sheet), $18 million in crypto investments, and $173 million for fiat loans and collateral, emphasizing prudent risk management.
· Financing Activities: In the third quarter of 2024, no new long-term debt was issued, indicating a strategic focus on organic growth and internal liquidity usage.
Labor Indicators and Other Data
· Total Employee Count in the Third Quarter of 2024: Increased from 3,486 in the second quarter of 2024 to 3,672.
· Monthly Active Users (MAUs): 7.8 million people, a 4.9% decrease from the second quarter of 2024 and a 16.4% year-over-year decline.
· Website Traffic: Decreased from 40.7 million in the second quarter of 2024 to 37.8 million, possibly reflecting waning interest or seasonal changes.
· Google Trends: Peaked at 74 in September, indicating fluctuations in public interest.
· App Downloads: Dropped from 14,189 in August to 8,928 in September, suggesting a slowdown in new user acquisition.
· Job Postings: Decreased to 818 in October, possibly indicating stabilization in hiring or ongoing restructuring.
Financial Ratios
Note: The following explanations are based on current data insights and are not definitive conclusions. It is recommended to independently review the data, and detailed data can be found in the Google Sheet.
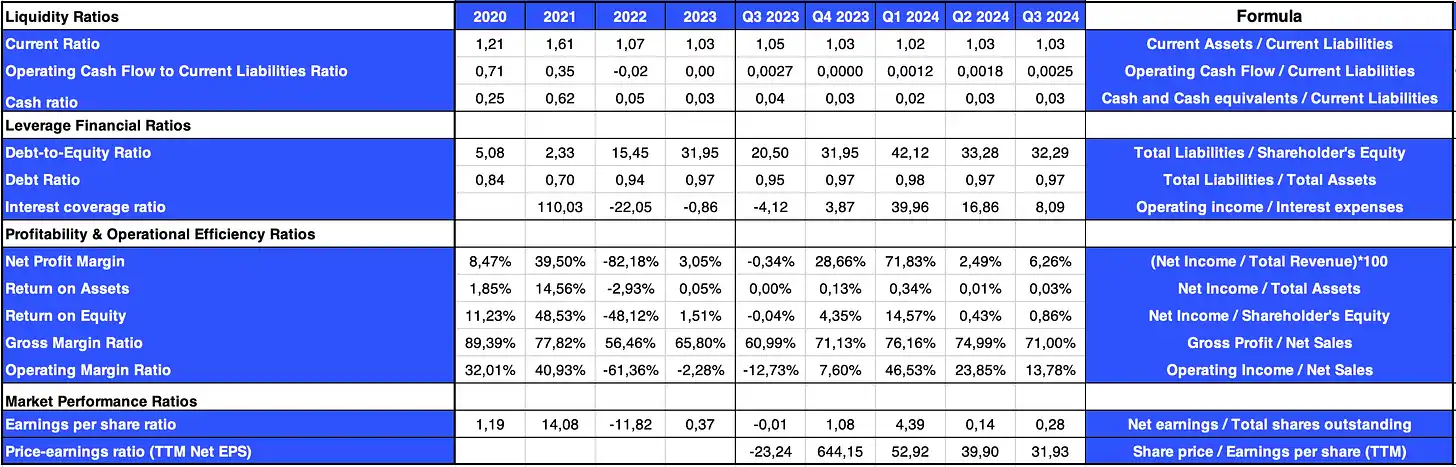
Financial Ratios (2020 - 2023; Q3 2023 - Q3 2024)
Liquidity Analysis
· Current Ratio (Q3 2024: 1.03): Remained stable, indicating limited coverage of liabilities by current assets.
· Operating Cash Flow to Current Liabilities Ratio (Q3 2024: 0.0025): Slightly increased, showing some recovery in cash flow generation capability.
· Cash Ratio (Q3 2024: 0.03): Maintained at a low level, highlighting strict cash management.
Leverage Ratio
· Debt-to-Equity Ratio (Q3 2024: 32.29): A high leverage ratio indicates increased financial risk.
· Debt Ratio (Q3 2024: 0.97): Debt nearly equals assets, showing a high reliance on debt.
· Interest Coverage Ratio (Q3 2024: 8.09): A positive value indicating that operating income is sufficient to cover interest expenses, reflecting good debt-servicing ability.
Profitability and Efficiency Ratios
· Net Profit Margin (Q3 2024: 6.26%): Improved from a loss in Q3 2023, showing an enhanced ability to generate net income.
· Return on Assets (ROA) (Q3 2024: 0.03%): Low asset utilization efficiency, suggesting potential operational efficiency issues.
· Return on Equity (ROE) (Q3 2024: 0.86%): Despite a slight increase, still relatively low, indicating inadequate shareholder returns.
· Gross Margin (Q3 2024: 71.00%): Improved, indicating effective cost control.
· Operating Profit Margin (Q3 2024: 13.78%): Markedly improved, showing more effective control of operating expenses.
Market Performance Ratios
· Earnings Per Share (EPS) (Q3 2024: $0.28): Recovered from negative earnings, demonstrating enhanced profitability.
· Price-to-Earnings (P/E) Ratio (TTM Net EPS) (Q3 2024: 31.93): A moderate P/E ratio indicates investors hold a cautiously optimistic view of the future.
For more information on the origin and development of Base, please refer to our June newsletter. Led by Jesse Pollak, Base was officially launched on July 13, 2023.
Overview
· Platform Mission: Base is Coinbase's Layer 2 solution on Ethereum, aiming to create a global on-chain economy that prioritizes innovation, creativity, and economic freedom, providing a secure, low-cost environment for decentralized application (dApp) development.
· Infrastructure and Governance: Base is built on the OP Stack to achieve scalability and cost-effectiveness. Base has confirmed that it will not issue a native Token (as stated by CEO Brian Armstrong on December 1, 2023). Base is collaborating with OP Labs to actively pursue decentralized governance and research initiatives, including EIP-4844 and the op-geth client, aligning with Coinbase's gradual decentralization vision.
· Ecosystem Development: Base has been widely embraced in the developer community, focusing on substantive product innovation rather than relying on token incentives. Coinbase's internal teams leverage Base to deploy smart contracts, enhancing both consumer and institutional product experiences, driving the adoption of on-chain applications through seamless onboarding and intuitive interfaces.
· Core Product: Base is positioned as a decentralized "app store," providing developers with an open platform that includes the Base name for simplified on-chain identity management, as well as a smart wallet that offers users a secure and programmable asset management solution.
· Strategic Positioning: Base not only competes within the Layer 2 ecosystem but also competes with traditional online platforms by providing an on-chain experience comparable to traditional web applications.
Key Metrics
In Base's application activity, the DeFi category has shown strong performance, with address activity growing significantly from 143.6K in the second quarter of 2024 to 405.7K in the third quarter. However, revenue in the third quarter dropped to $7.3 million, lower than the second quarter's $24.2 million. Stablecoin transfer volume saw a significant increase from $97.8 billion in the second quarter to over $415 billion in the third quarter, indicating rising transaction demand. The ratio of new users to returning users also changed: from 107K to 278K in the second quarter, 420K to 450K in the third quarter, and reaching 509K to 827K in the fourth quarter. Sybil addresses decreased to 178K in the fourth quarter, while non-Sybil addresses reached 1.2 million, with 550K Sybil addresses and 320K non-Sybil addresses in the third quarter.
As we can see in the chart, as of November 7th, Base is the leading Layer 2 blockchain. A few weeks ago, it surpassed Arbitrum in Total Value Locked (TVL) and has maintained its position as the top Layer 2 in daily active addresses and daily transactions for several months.
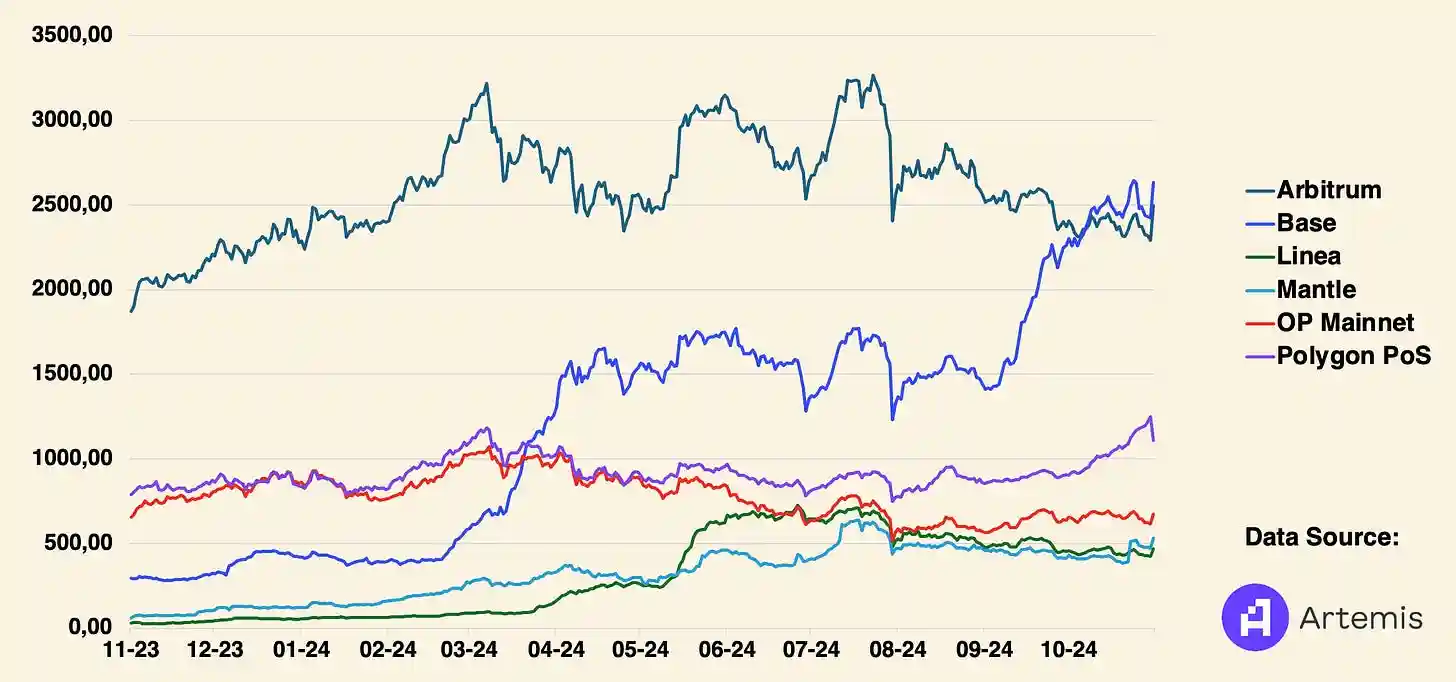
Total Value Locked in Smart Contracts (in millions of USD)
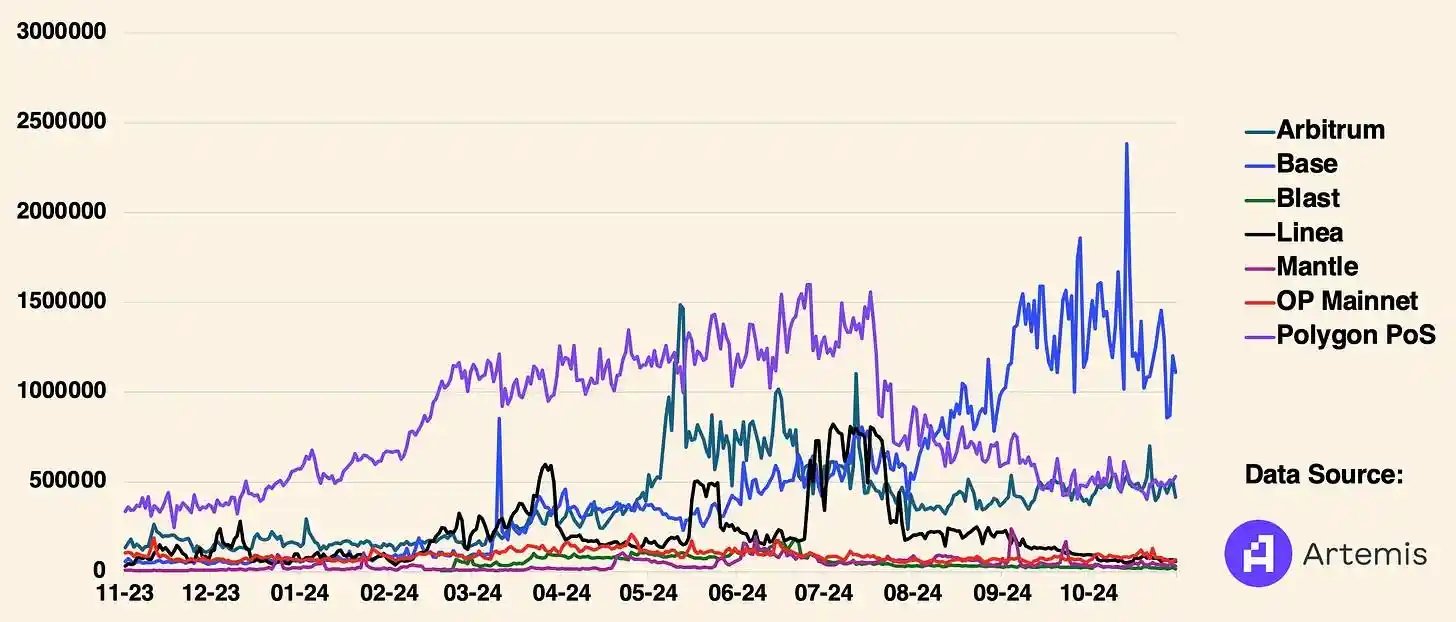
Daily Active Addresses (unique on-chain wallet interactions per day)
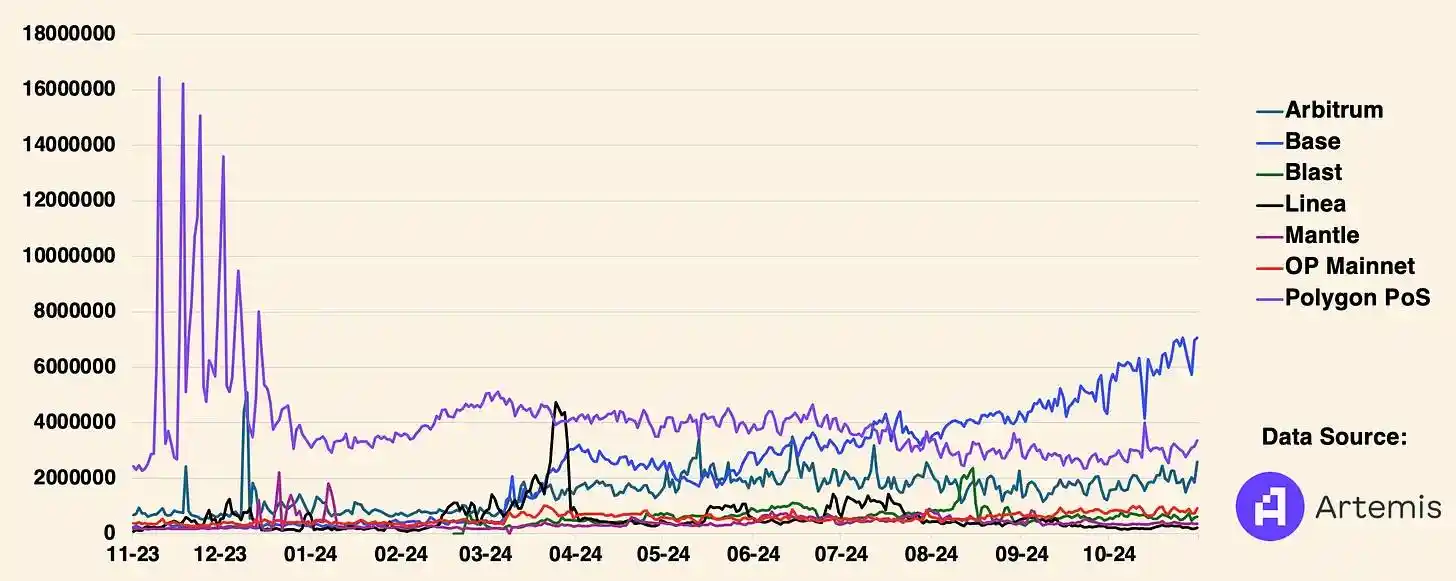
Daily Transactions (unique on-chain protocol interactions)
Recommended
The Wall Street Journal: How is AI Trading Stealing the Limelight from Cryptocurrency?
Aug 15, 14:00
Tencent Still Has a Dream
Aug 15, 11:27
To Catch North Korean Hackers, They Set Up a Fake Project
Aug 15, 10:00
From Litigation to Settlement: Positive Signal Released by HTX's Negotiation with FCA
Aug 14, 19:32
11,742 Shipping Addresses Exposed Alongside Trezor Orders
Aug 14, 19:01
Founder Interview: FOMO Creator Explains How They Added 30,000 Users in One Day and Became One of the Fastest-Growing Crypto Apps
Aug 14, 18:37