Has the Crypto Market Topped Out? Key Metric Retraces Nearly 20%

Original Title: "Is the Crypto Market Ready to Top Out? Nearly 20% Indicator Has Reached Its Peak and Retracted"
Original Authors: Viee, Biteye
Each bull market not only creates wealth but also generates countless wealth illusions. When the market is euphoric, few can elegantly "top out." Faced with a market of sharp rises and falls, how to exit near the peak timely, avoiding asset shrinkage from deep retracements, requires us to comprehensively assess multiple market indicators.
In this article, Biteye analyzed 15 commonly used top-out indicators and found that one-fifth of the indicators have reached the top-out range in the past 24 years, namely: Bitcoin Rhodl Ratio, USDT Current Savings, Altcoin Seasonality Index. In this case, how should we respond to the market's future development?
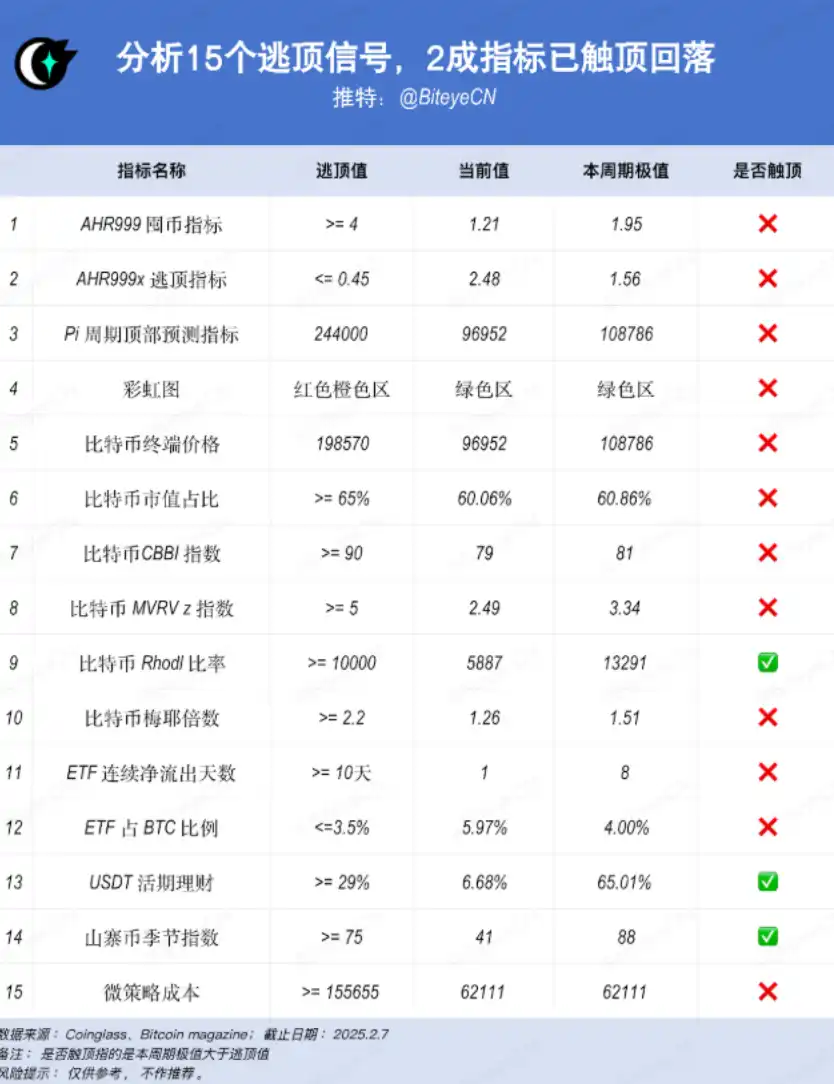
1. AHR999 Coin Hoarding Indicator
This indicator was created by Weibo user ahr999 to assist Bitcoin dollar-cost averaging users in making investment decisions based on opportunistic strategies. The indicator implies the short-term dollar-cost averaging yield of Bitcoin and the deviation of Bitcoin's price from the expected valuation.
Indicator Range:
· >4: Suggests a significant reduction in position
· 1.2-4: Observation area, maintain vigilance
· 0.45-1.2: Dollar-cost averaging area, can gradually build positions
· <0.45: Strong bottom-fishing area
Current Status: The indicator value is 1.21, not yet at the top, in the observation zone, it is recommended to remain cautious.
Link: https://www.coinglass.com/en/pro/i/ahr999
2. AHR999 Top-Out Indicator
The AHR999 Top-Out Indicator is the sister indicator of the Coin Hoarding Indicator, specifically designed to identify market top areas. This indicator judges whether the market is overheated by observing the price's deviation from the long-term trend line. It has given accurate warning signals at the peaks of the two major bull markets in 2017 and 2021, serving as a crucial tool to avoid chasing highs.
Indicator Range:
· <=0.45: Severely overheated, consider topping out
Current Status: The indicator value is 2.48, and no top signal has occurred in this cycle.
Link: https://www.coinglass.com/en/pro/i/ahr999-escape
3. Pi Cycle Top Indicator
The Pi Cycle Top Indicator predicts potential market tops by comparing the 111-day moving average and the 350-day moving average. Historically, when moving averages cross, Bitcoin's price has typically been near a cycle top, indicating a potential market reversal.
Signal Characteristics:
· Two-Line Cross: Top signal triggered
· Quick Divergence: Bearish outlook
· Gradual Convergence: Cautionary sign
Current Status: The two lines still have a significant distance, no top signal has occurred yet, and the next cross is expected in October 2025.
Link: https://www.bitcoinmagazinepro.com/charts/pi-cycle-top-prediction/
4. Bitcoin Rainbow Chart
The Rainbow Chart is an intuitive long-term valuation model that divides the Bitcoin price range into 9 different color bands. This model is based on logarithmic regression, considering Bitcoin's long-term growth and cyclical characteristics. Throughout multiple market cycles, the Rainbow Chart has provided good guidance, especially in identifying extreme areas.
Indicator Ranges:
· Red: Bubble territory, sell signal
· Yellow: Overbought zone, stay cautious
· Green: Healthy zone, hold range
· Blue: Value zone, buying opportunity
Current Status: The price is in the green zone, indicating relatively reasonable valuation, and no top signal has been generated.
Link: https://www.coinglass.com/en/pro/i/bitcoin-rainbow-chart
5. Bitcoin Terminal Price Indicator
The Terminal Price is the Transfer Price multiplied by 21. The Transfer Price is calculated by dividing the number of days the coin has been dormant by the existing Bitcoin supply and its age. This metric effectively filters out market speculation and reflects the true value of the Bitcoin network.
Signal Feature: The closer the Bitcoin price is to the red line, the closer the market is to the top.
Current Status: Not Yet Topped
Link: https://www.bitcoinmagazinepro.com/charts/terminal-price/
6. Bitcoin Dominance
The Dominance indicator reflects Bitcoin's dominance in the overall cryptocurrency market. This indicator is commonly used to assess market cycles and fund flows. A decrease in Bitcoin dominance usually signals a shift of funds towards altcoins. Historical data shows that changes in Bitcoin dominance often precede turning points in the entire cryptocurrency market.
Indicator Ranges:
· 65%: Bitcoin Bullish Period
· 40-65%: Balanced Period
· <40%: Altcoin Active Period
Current Status: Dominance at around 60%, situated in a relatively balanced range.
Link: https://www.coinglass.com/zh/pro/i/MarketCap
7. Bitcoin CBBI Index
The CBBI (Combined Bitcoin Binary Index) is a comprehensive index that integrates multiple technical indicators and on-chain data to effectively identify turning points in bull and bear cycles. Its strength lies in reducing the limitations of a single indicator through multidimensional data analysis.
Indicator Range: Above 90 indicates the market has reached the top.
Current Status: Index value is 79, indicating the market is slightly overheated but has not yet peaked.
Link: https://www.coinglass.com/zh/pro/i/cbbi-index
8. Bitcoin MVRV Z-Score
The MVRV Z-Score is a significant on-chain analysis indicator that evaluates market cycles by comparing market cap to realized value deviation. When this indicator is too high, it signifies that Bitcoin's market cap is overvalued relative to its realized value, which is detrimental to the Bitcoin price. Conversely, undervaluation is indicated by a low score. Based on historical experience, when this indicator reaches a historical high, the probability of a downward trend in Bitcoin price increases, highlighting the risks of chasing highs.
Indicator Range: Greater than 5 implies the market has reached a top.
Current Status: Index is at 2.5, not yet at a top.
Link: https://www.coinglass.com/en/pro/i/bitcoin-mvrv-zscore
9. Bitcoin Rhodl Ratio
The Rhodl Ratio is a composite on-chain metric that assesses potential market turning points by comparing the behavioral characteristics of hodlers across different time periods. When the RHODL Ratio starts approaching the red zone, it may indicate an overheated market. Historically, this has been a good exit point for investors in each cycle.
Indicator Range: Approaching the red zone may indicate an overheated market. A ratio>= 10000 suggests the market is nearing a top.
Current Status: Currently not in the red zone, but this metric did enter the top zone in November 2024.
Link: https://www.coinglass.com/en/pro/i/r-hodl-ratio
10. Bitcoin Mayer Multiple
The Bitcoin Mayer Multiple is a technical indicator proposed by Trace Mayer for analyzing the state of the Bitcoin market. It evaluates the market's relative valuation level by comparing Bitcoin's current price to its 200-day moving average (200DMA).
Indicator Range:
· Mayer Multiple> 1: Indicates the current Bitcoin price is above its 200-day moving average, suggesting the market may be overbought.
· Mayer Multiple <1: Indicates the current Bitcoin price is below its 200-day moving average, suggesting the market may be oversold.
· Mayer Multiple ≈ 1: Indicates the current Bitcoin price is close to its 200-day moving average, suggesting the market may be relatively balanced.
· Historically, when the Mayer Multiple exceeds 2.4, it often signals an overheated market, potentially leading to a pullback or bear market. When the Mayer Multiple is below 0.8, the market may be undervalued, presenting a potential buying opportunity.
Current Status: The index is 1.26, indicating the market is in overbought territory but has not peaked yet.
Link: https://www.coinglass.com/en/pro/i/mayer-multiple
11. ETF Consecutive Net Outflow Days
This metric tracks the fund flow of Bitcoin ETFs, where consecutive net outflow days often reflect institutional investor confidence. This is a relatively new metric that has gained market attention since the launch of spot ETFs.
Signal Characteristics:
· 10 Days: Significant Bearish Signal
· 5-10 Days: Caution Needed
· <5 Days: Normal Fluctuation
Current Status: Consecutive net outflow for 1 day, within the normal market fluctuation range. The longest streak in this cycle is 8 days, with no occurrence of a 10-day period.
Link: https://www.coinglass.com/en/bitcoin-etf
12. ETF to BTC Ratio
This indicator reflects the percentage of Bitcoin held by ETFs in circulation, used to evaluate institutional participation. This metric can reflect the level of acceptance and depth of participation of traditional financial institutions in Bitcoin.
Signal Characteristics: <=3.5% is a Topping Out indicator, also implying low institutional participation.
Current Status: The ratio is close to 6%, indicating institutional participation is in a healthy growth stage.
Link: https://www.coinglass.com/en/bitcoin-etf
13. USDT Current Savings Rate
The USDT current savings rate is a key indicator of measuring market funding costs, reflecting the overall liquidity condition of the cryptocurrency market.
Signal Characteristics: >=29% is in the Topping Out range.
Current Status: The rate is approximately 6.68%, within the normal range. However, in March 2024, this metric entered the Topping Out range, reaching 65%.
Link: https://www.coinglass.com/en/pro/i/MarginFeeChart
14. Altcoin Season Index
This index is used to determine whether the market is entering the altcoin season. By comparing the performance of Bitcoin with major altcoins, it can be judged whether funds are starting to flow into higher-risk small-cap coins.
Index Range:
· 75: Altcoin Season, a value above 75 indicates the market is approaching its peak
· 25-75: Balanced Phase
· <25: Bitcoin Dominance Phase
Current Status: Index is at 41, however, the index entered the peak range, reaching 88 in December 2024.
Link: https://www.coinglass.com/en/pro/i/alt-coin-season
15. MicroStrategy Cost Index
This index tracks MicroStrategy's average holding cost of Bitcoin as a reference benchmark for institutional investors. As MicroStrategy is one of the largest corporate Bitcoin holders, its cost line often becomes a significant psychological price level in the market.
Index Range:
· Current Price Above Cost: Institutional Profit Zone
· Current Price Near Cost: Support Level
· Current Price Below Cost: Potential Buying Opportunity
Current Status: MicroStrategy's average cost is around $60,000, within the institutional profit zone.
Link: https://www.coinglass.com/en/pro/i/micro-strategy-cost
"Bear markets make you bankrupt, bull markets make you poor." Stay rational during market euphoria, exit entirely during frenzy; it's much harder than buying the bottom. Currently, only a few indicators are showing top signals, which do not definitively mean the entire market has peaked. If there is a perceived risk of a market top, you can also consider:
Setting incremental sell-off points, don't expect the perfect peak.
Convert profits to a stablecoin or fiat currency instead of turning to higher-risk altcoins.
Sell early at the peak rather than late. Taking profits is not the end, but preparation for the next accumulation.
Remember, every peak is a wealth-building opportunity for some and a wealth trap for many. The market provides equal opportunities to everyone, but those who can seize the opportunity are often the ones who are prepared.
Recommended
The Wall Street Journal: How is AI Trading Stealing the Limelight from Cryptocurrency?
Aug 15, 14:00
Tencent Still Has a Dream
Aug 15, 11:27
To Catch North Korean Hackers, They Set Up a Fake Project
Aug 15, 10:00
From Litigation to Settlement: Positive Signal Released by HTX's Negotiation with FCA
Aug 14, 19:32
11,742 Shipping Addresses Exposed Alongside Trezor Orders
Aug 14, 19:01
Founder Interview: FOMO Creator Explains How They Added 30,000 Users in One Day and Became One of the Fastest-Growing Crypto Apps
Aug 14, 18:37