On-Chain Data Classroom (Part 2): The Evergreen Hodlers, What Was Their BTC Acquisition Cost?

Original Article Title: "On-Chain Data Academy (Part 2): Evergreen Hodlers, What Is Their $BTC Acquisition Cost?"
Original Article Author: Mr. Berg, On-Chain Data Analyst
This article is the second installment of the On-Chain Data Academy series, with a total of 10 articles. It takes you step by step through understanding on-chain data analysis. Interested readers are welcome to follow this series.
Related Reading: "On-Chain Data Academy (Part 1): Do You Know the Market-Wide BTC Average Acquisition Cost?"
- This article will continue the concept of MVRV from the previous article and introduce LTH-MVRV
- LTH = Long Term Holder, defined as holders of BTC for over 155 days
- LTH-MVRV represents the profitability status of long-term holders
- LTH-RP represents the average acquisition cost of long-term holders
Let's now dive into the main content!
LTH = Long Term Holder, defined by Glassnode as holders of BTC for over 155 days.
As for why it is 155 days, Glassnode provides a detailed explanation on its official website. Due to the complexity of the content, we will not delve into it here. Interested readers can explore it on their own.
LTH-RP, which stands for Long Term Holder's Realized Price, is their average holding cost. The algorithm divides the LTH-Realized Cap by the circulating supply.
As shown in the diagram below, the light green color represents the market-wide Realized Price, while the dark green represents the LTH Realized Price. The holding cost of long-term holders is typically lower than the market-wide average cost.
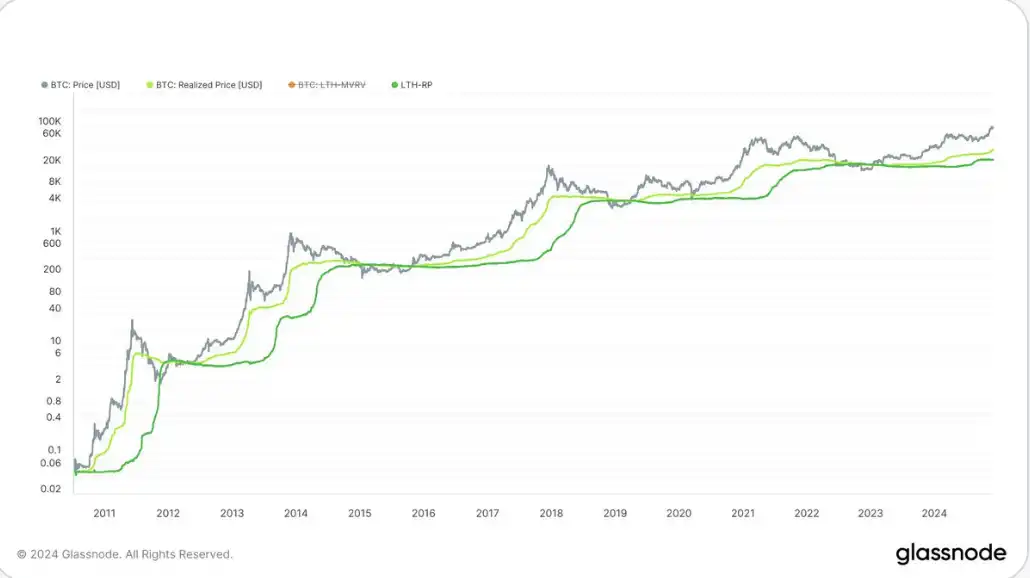
Comparison of Realized Price and LTH-RP
Representing the profit status of long-term holders, the calculation of LTH-MVRV is similar to MVRV. The algorithm for LTH-MVRV is "Current Market Cap / LTH-Realized Cap," which can also be written as "Current Market Price / LTH-Realized Price."
As shown in the chart below, the change in LTH-MVRV is usually more pronounced than MVRV, as the profits from LTH are typically more substantial.
Comparison ofMVRV and LTH-MVRV, where the orange line represents LTH-MVRV and the yellow line represents MVRV
When LTH-MVRV is <1 (or when the market price is below LTH-RP), it means even the average long-term holder is at a loss, which typically indicates a good bottom fishing opportunity.
As shown in the chart below, I have marked the times when LTH-MVRV is <1, which almost always correspond to cyclical major bottoms. When designing a bottom fishing strategy, this indicator can be considered for inclusion in your analysis~
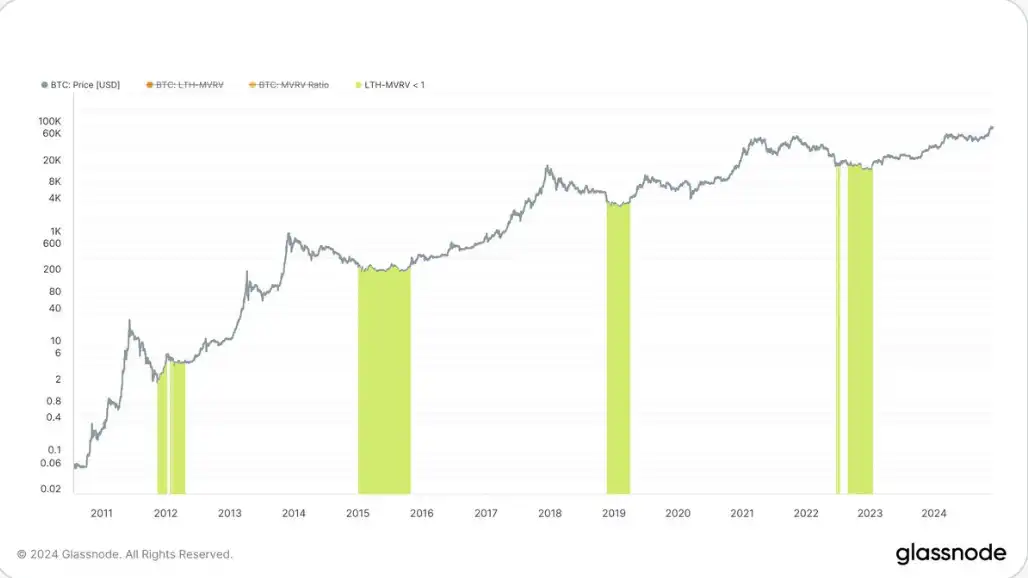
Price Corresponding to LTH-MVRV <1
Recommended
The Wall Street Journal: How is AI Trading Stealing the Limelight from Cryptocurrency?
Aug 15, 14:00
Tencent Still Has a Dream
Aug 15, 11:27
To Catch North Korean Hackers, They Set Up a Fake Project
Aug 15, 10:00
From Litigation to Settlement: Positive Signal Released by HTX's Negotiation with FCA
Aug 14, 19:32
11,742 Shipping Addresses Exposed Alongside Trezor Orders
Aug 14, 19:01
Founder Interview: FOMO Creator Explains How They Added 30,000 Users in One Day and Became One of the Fastest-Growing Crypto Apps
Aug 14, 18:37