Intensifying Global Financial Market Turbulence: Can Bitcoin's Key Support Level Withstand the Pressure?
Original Article Title: Tariffs and Turmoil
Original Article Author: UkuriaOC, CryptoVizArt, Glassnode
Original Article Translation: Daisy, ChainCatcher
The Trump administration's announcement of a "Liberation Day" tariff policy has led to significant turmoil in the financial markets, with major macro indices experiencing widespread declines, and the digital asset market has not been spared, undergoing a comprehensive downturn.
Summary
· The news of the U.S. imposing tariffs has severely disrupted the world's major financial markets, with several markets experiencing one of their worst trading days since March 2020.
· Inflows into digital assets have almost come to a standstill, with significant liquidity contraction, bringing strong downward pressure.
· However, looking at the price movements of Bitcoin and Ethereum, as prices trend lower, the scale of losses exiting the market has gradually decreased, possibly indicating that the selling pressure in the short term is beginning to diminish.
· The overall decline in the digital asset market is widespread.
· The market capitalization of altcoins has dropped from $1 trillion in December 2024 to the current $583 billion.
· An integrated analysis of on-chain and technical models shows that for Bitcoin to regain upward momentum, it must reclaim $93,000.
· The range of $65,000 to $71,000 below is a key support level that the bulls must defend.
Comprehensive Market Downturn
The Trump administration's announcement of a "Liberation Day" tariff policy has triggered severe market turmoil, with major stock indices generally declining. The U.S. policy stance has shifted towards weakening the dollar, lowering interest rates, reducing oil prices, and shrinking fiscal spending. These overlapping factors could lead to a significant slowdown in the U.S. economy and cause a substantial overall liquidity contraction.
The uncertainty caused by tariffs has become the catalyst for a surge in market "safe-haven" sentiment, triggering widespread selling, with multiple major financial indices posting their worst performance since March 2020.
Source: Yahoo Finance
The digital asset market has been particularly sensitive to changes in global liquidity and has similarly not been spared in this downturn, with numerous cryptocurrency prices experiencing double-digit declines.
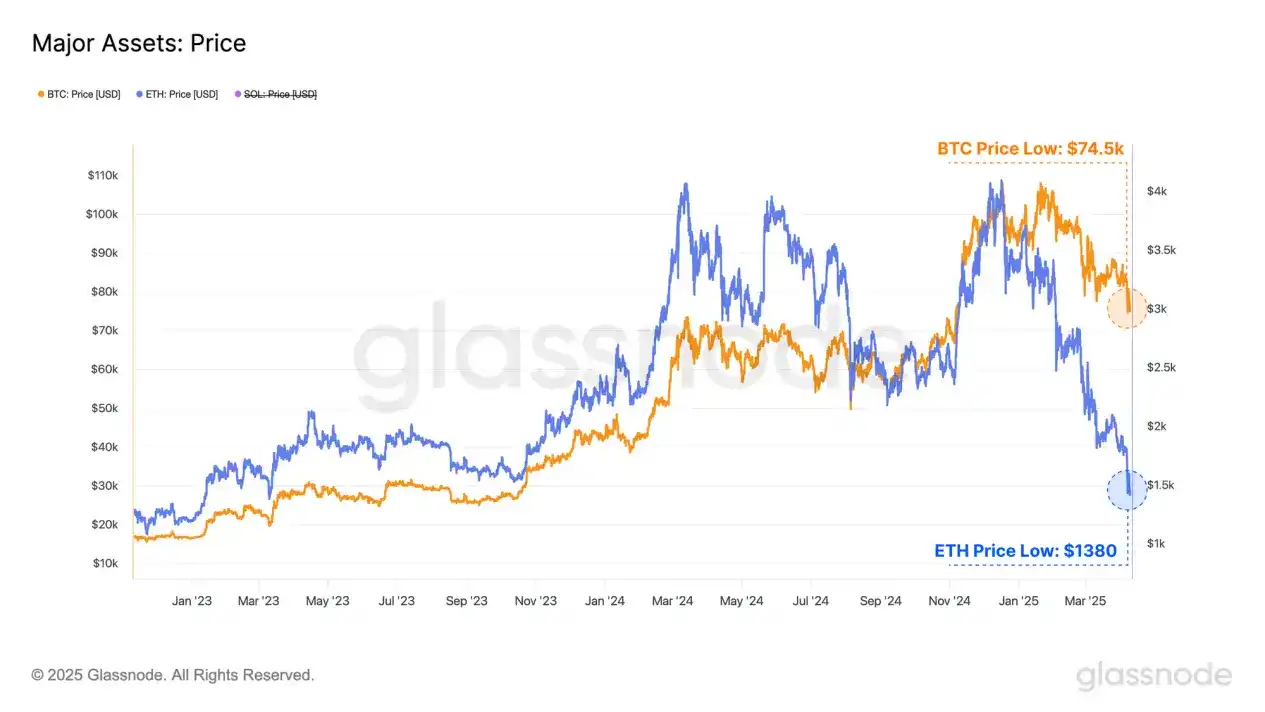
The price of Bitcoin, as the leading asset, dropped from $83,500 to $74,500, with a market cap loss of around $150 billion.
Ethereum, as the second-largest crypto asset, saw a more significant decline, with the price falling from $1,800 to $1,380, resulting in a market cap decrease of about $40 billion.
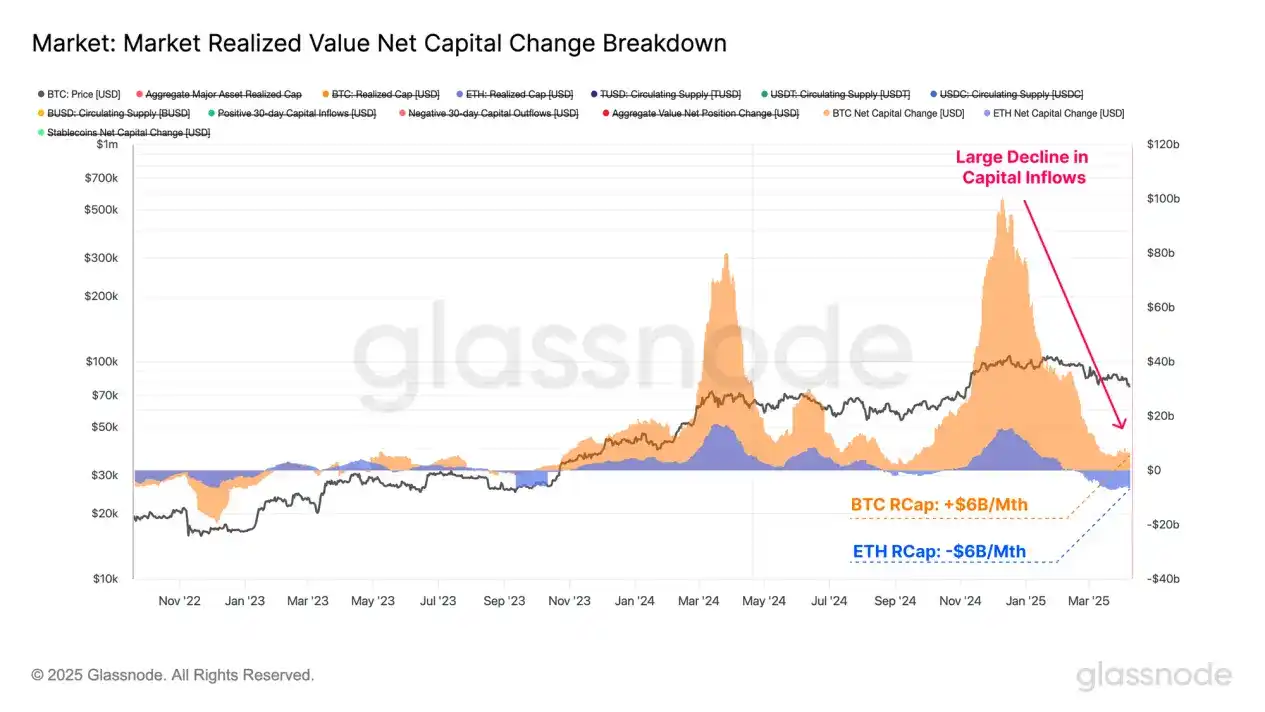
Since the beginning of the year, the net inflows into the two major mainstream crypto assets have significantly decreased. This trend is mainly reflected in the 30-day "Realized Cap" change, which measures the monthly net capital flow of assets.
· Bitcoin's monthly inflow peak reached $100 billion, but has now shrunk to around $60 billion;
· Ethereum's monthly inflow peak was $15.5 billion, which has now turned into a net outflow of $6 billion.
The inflow of funds into the Bitcoin network is gradually stagnating, indicating a lack of new incremental funds in the market to support higher prices. Ethereum's outflow of funds is mainly due to ETH bought at higher prices being spent at lower prices, resulting in a capital loss. This also indicates that Ethereum faces greater resistance compared to Bitcoin, with a relatively weaker market performance.
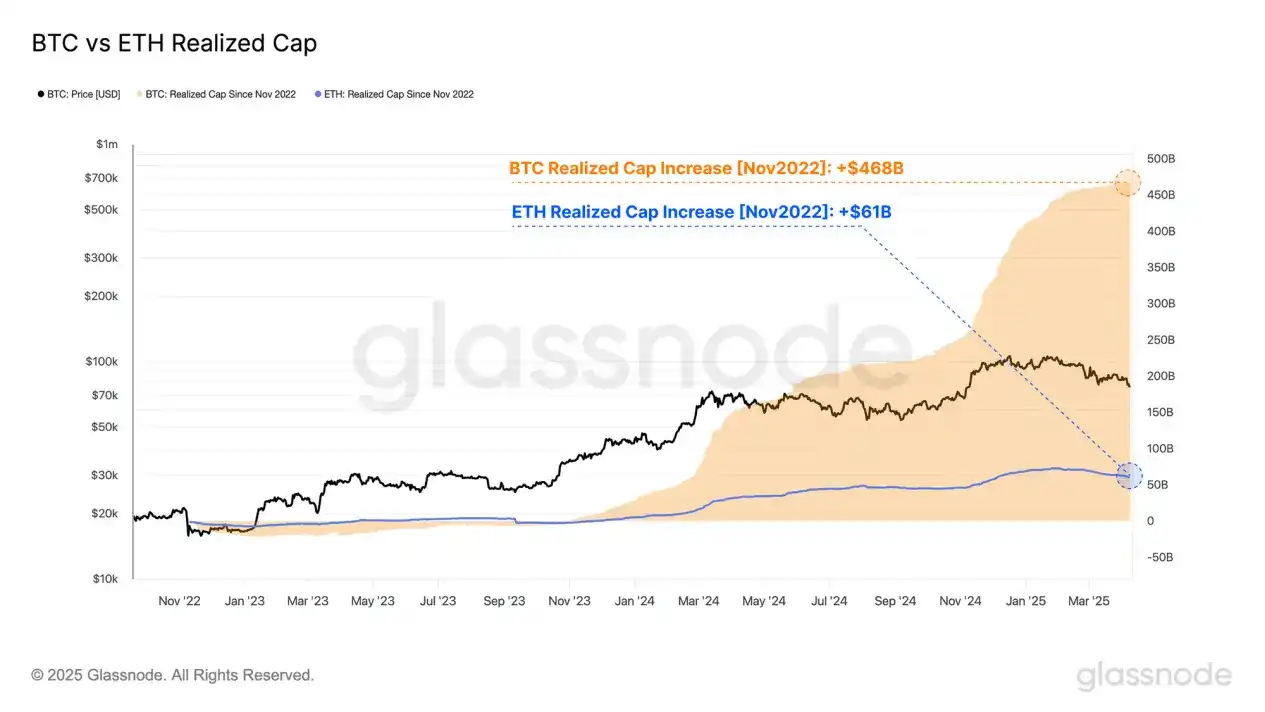
If we take the FTX collapse at the end of 2022 as a starting point and observe the overall change in Bitcoin and Ethereum's "Realized Cap," we can quantify the capital absorbed by these two assets since the low point of this cycle.
Bitcoin's realized cap has grown from $402 billion to $870 billion, an increase of $468 billion, representing a 117% increase; Ethereum's realized cap has grown from $183 billion to $244 billion, an increase of $61 billion, representing a 32% increase.
The difference between the two in terms of fund inflows partially explains the divergence in the performance of the two major assets markets since 2023. Ethereum has attracted significantly less funding and new demand in this cycle compared to Bitcoin, resulting in a relatively weaker price increase and failing to reach a new high, while Bitcoin broke through the $100,000 mark in December 2024.
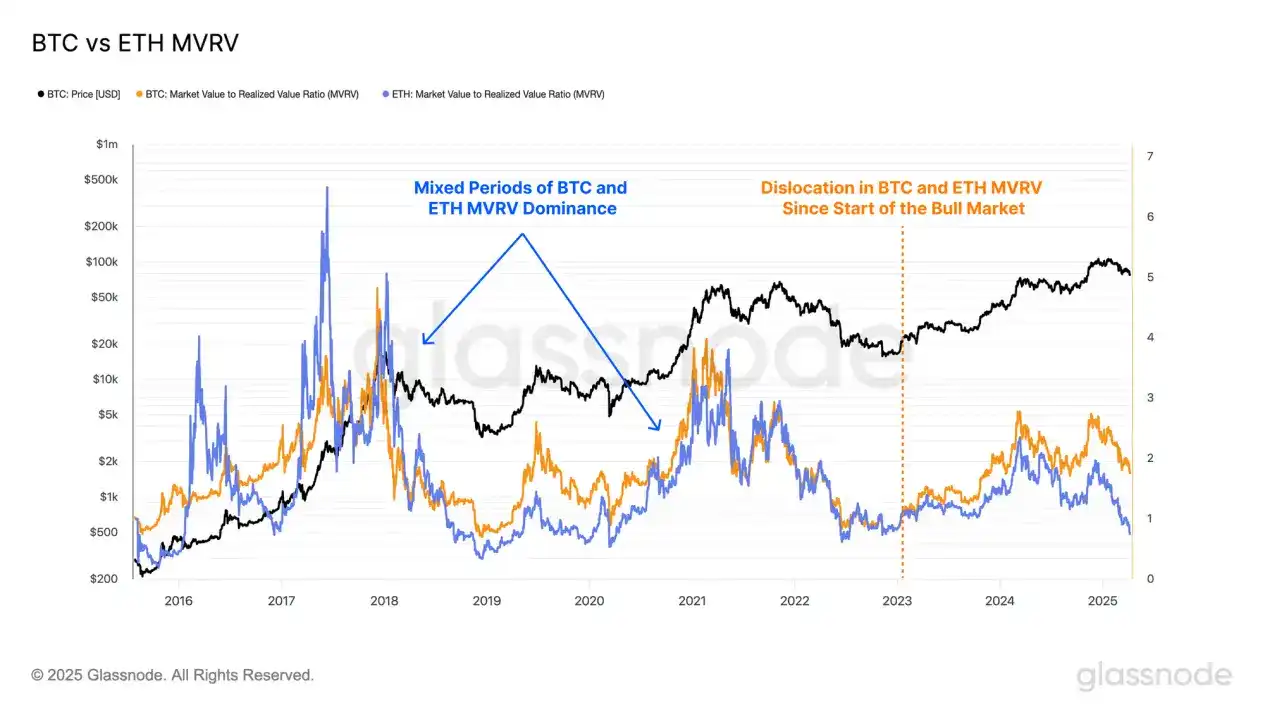
The MVRV ratio is used to measure the relationship between the spot price and the realized price, reflecting the average profit or loss of each asset holder. When the MVRV ratio is above 1, it indicates an average unrealized profit; when it is below 1, it indicates an unrealized loss.
Since the start of this bull run in January 2023, Bitcoin and Ethereum's MVRV Ratio have once again shown significant divergence. Bitcoin investors have consistently held a higher realized profit, while Ethereum's MVRV Ratio dropped below 1.0 again in March this year, indicating that a majority of holders are now at a loss.
By calculating the difference in MVRV Ratio between Bitcoin and Ethereum, we can identify whether, on average, Bitcoin holders have outperformed or underperformed Ethereum holders during certain periods.
A positive difference indicates that on average, Bitcoin investors' realized profits are higher than Ethereum investors', while a negative difference signifies that Ethereum investors have stronger average profit-taking capabilities.
As mentioned earlier, since the beginning of this bull run, Bitcoin investors' average profit level has consistently been higher than that of Ethereum investors.
As of now, this trend has lasted for 812 days, marking the longest duration on record.
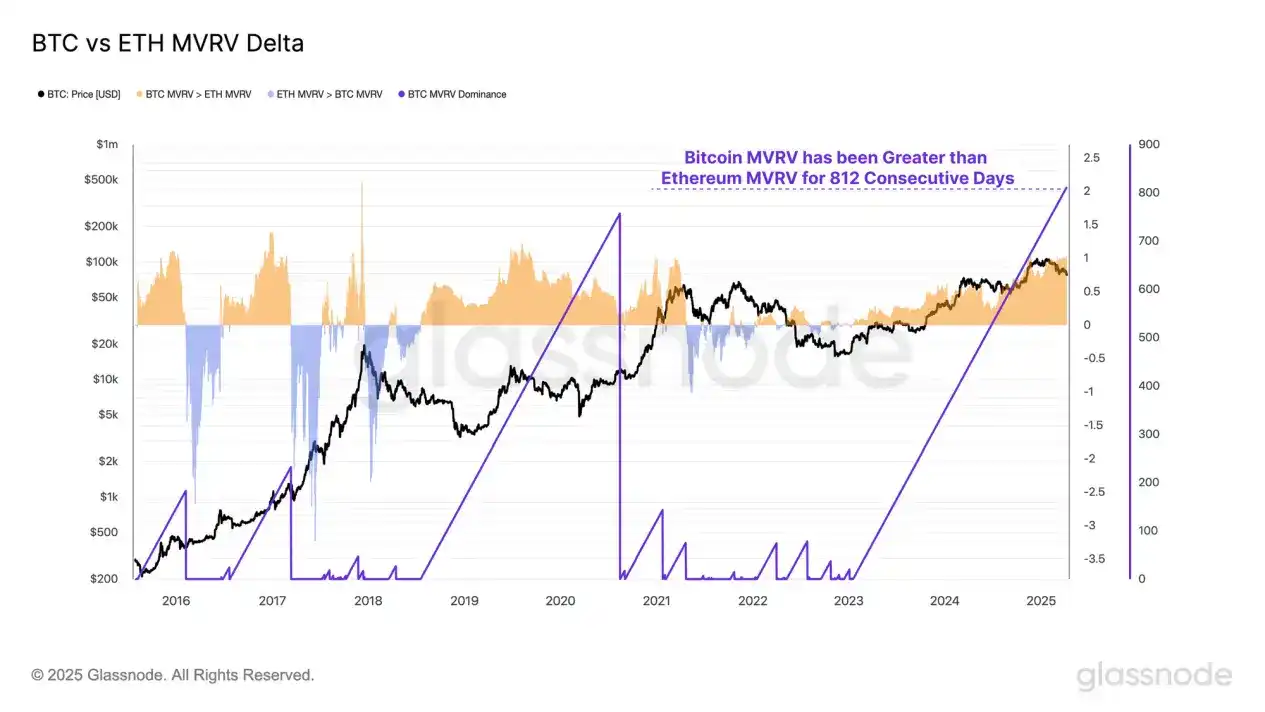
It is evident that Ethereum has shown relatively weak performance in this bull run, mainly due to the significantly smaller inflows of funds and investment demand compared to Bitcoin. This divergence trend can be further illustrated through the ETH/BTC price ratio.
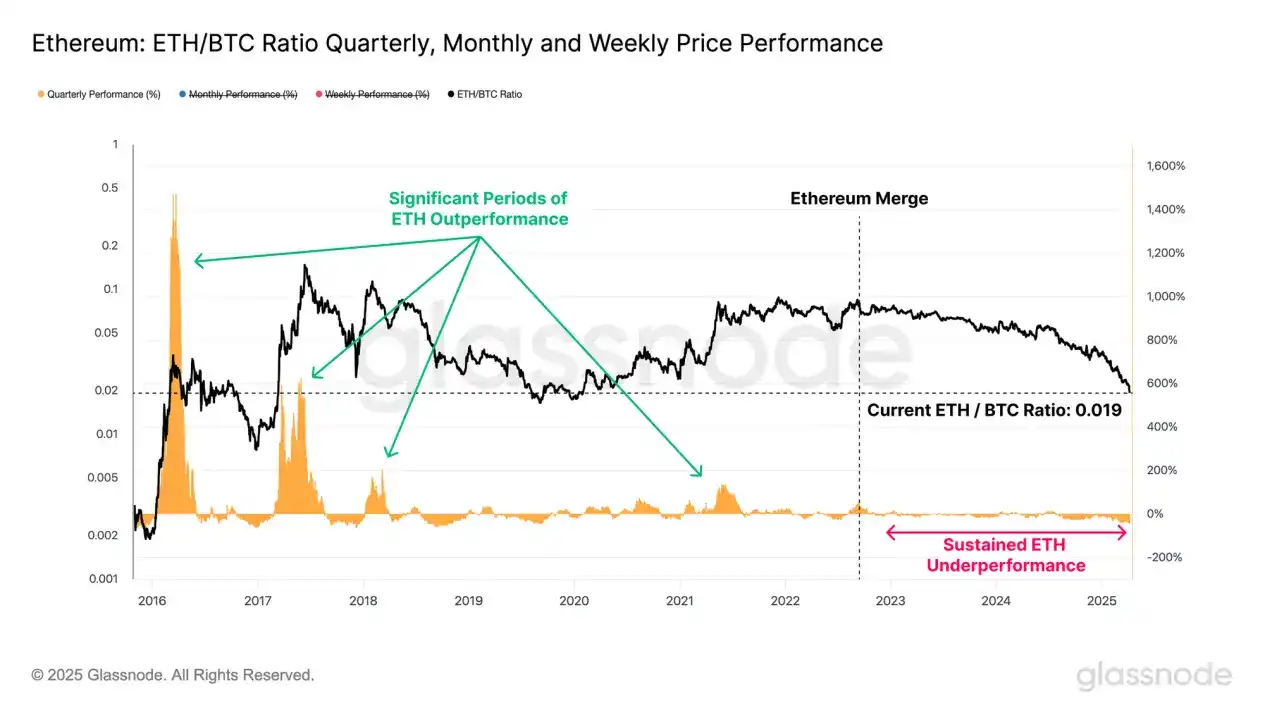
Since the September 2022 "Merge" upgrade, the ETH/BTC exchange rate has plummeted from 0.080 to the current 0.0196, representing a 75% decline. This is the lowest level for this pair since January 2020, with only 500 days out of 3531 trading days having a ratio lower than the current level.
Furthermore, in this current bull market, there have been hardly any prolonged periods where Ethereum has consistently outperformed Bitcoin, which is extremely rare in past bull markets. This further indicates that the market structure of this cycle has significantly deviated from the historical patterns and performance investors are familiar with.
Review of Loss Situations
After experiencing a sharp decline like this week, examining investors' reactions is particularly important, especially as bear markets are often characterized by rising panic and large-scale losses.
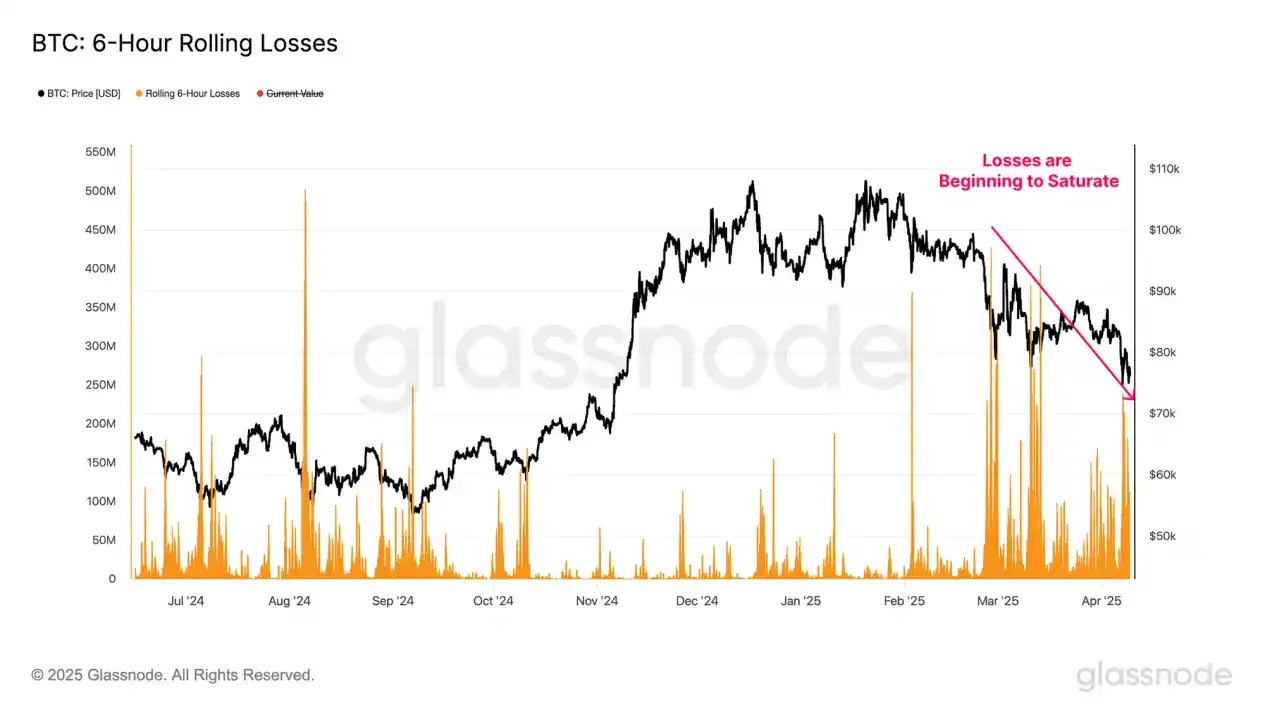
By assessing the realized loss situation within a 6-hour rolling window, we can better understand the behavior and emotional responses of market participants during the current downtrend.
A significant "surrender sell-off" event occurred among Bitcoin investors, with the peak loss value reaching as high as $240 million within a particular 6-hour window, approaching one of the largest loss events of this cycle.
However, as the price continues to dip, the size of realized losses is gradually shrinking, indicating that within the current price range, the market may be showing signs of short-term selling pressure exhaustion.
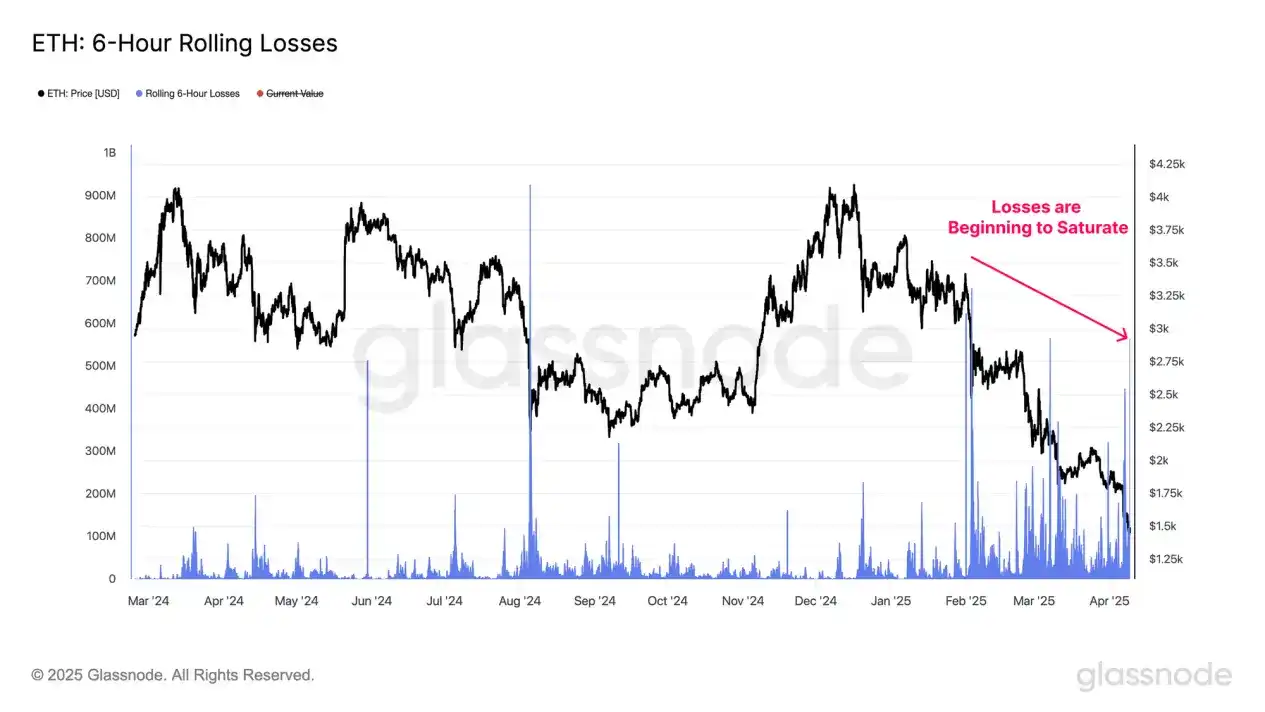
Ethereum is also exhibiting a similar behavior pattern. During this round of decline, its single largest realized loss peak reached as high as $564 million, making it one of the largest sell-off events since the bull market began in January 2023.
As the price gradually dips, both Bitcoin's and Ethereum's realized loss levels are weakening, indicating that investors may be gradually adapting to the lower price range and the current volatile market environment.
Comprehensive Market Contraction
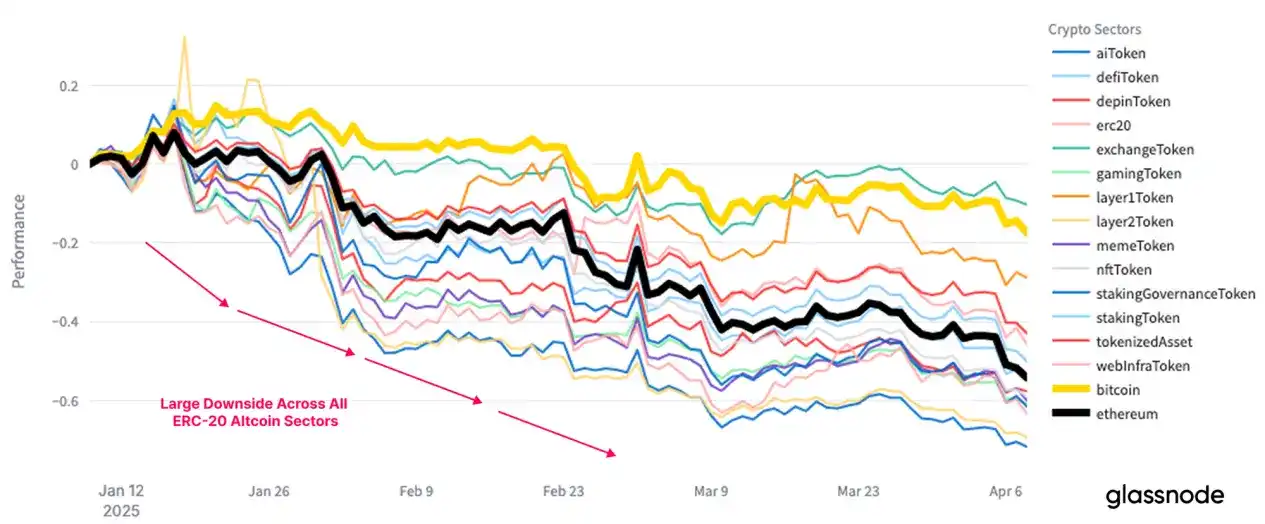
The ongoing tightening of market liquidity has triggered a significant devaluation across the entire altcoin sector. Assets further along the risk curve are particularly sensitive to liquidity shocks, usually accompanied by more severe price retracements.
As of December 2024, the overall altcoin market capitalization (excluding Bitcoin, Ethereum, and stablecoins) reached a peak of $1 trillion in this cycle. Subsequently, the market cap has seen a sharp retreat, currently plummeting to $583 billion, with a drop of over 40% in just a few months.
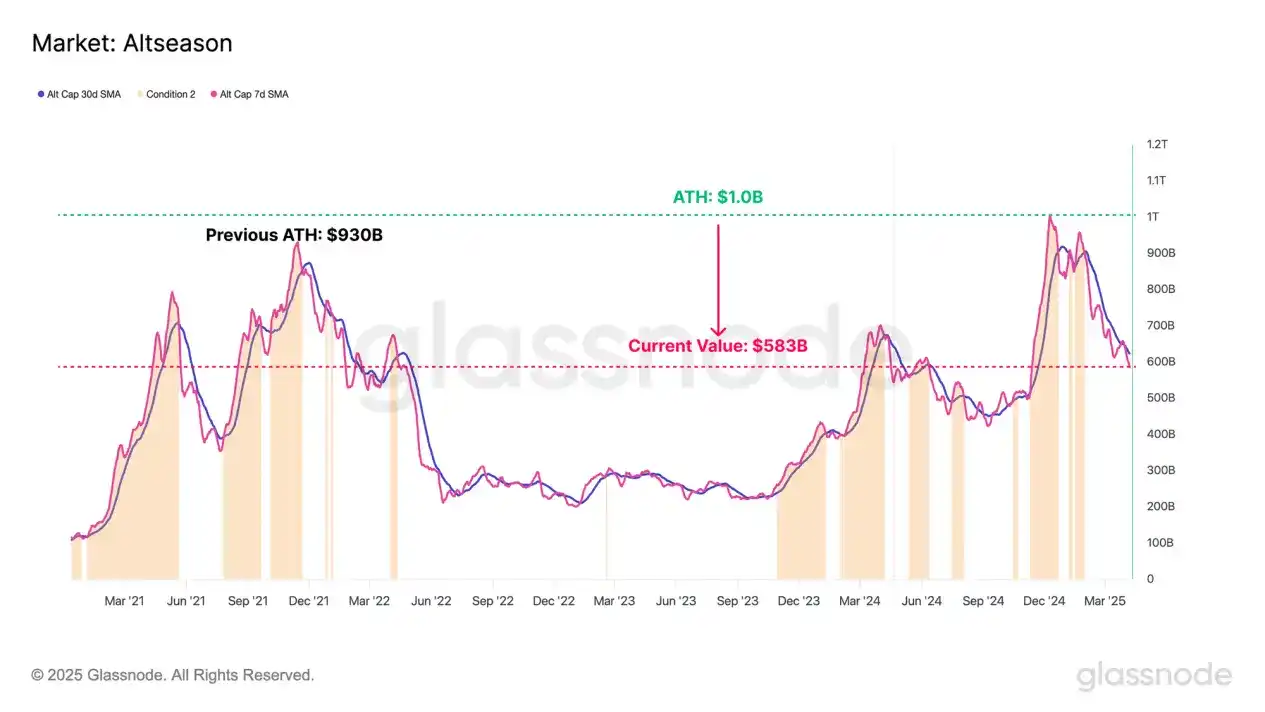
It is worth noting that in this round of pullback, various subsectors of altcoins have not shown significant differentiated trends. The overall decline has been widespread, with all subsectors experiencing significant devaluation, and even Bitcoin recording negative returns over the past three months.
Range Assessment
Finally, we will evaluate the market's response to key technical indicators and on-chain cost ranges, as these reference tools help investors make assessments and decisions in an oscillating and uncertain market environment.
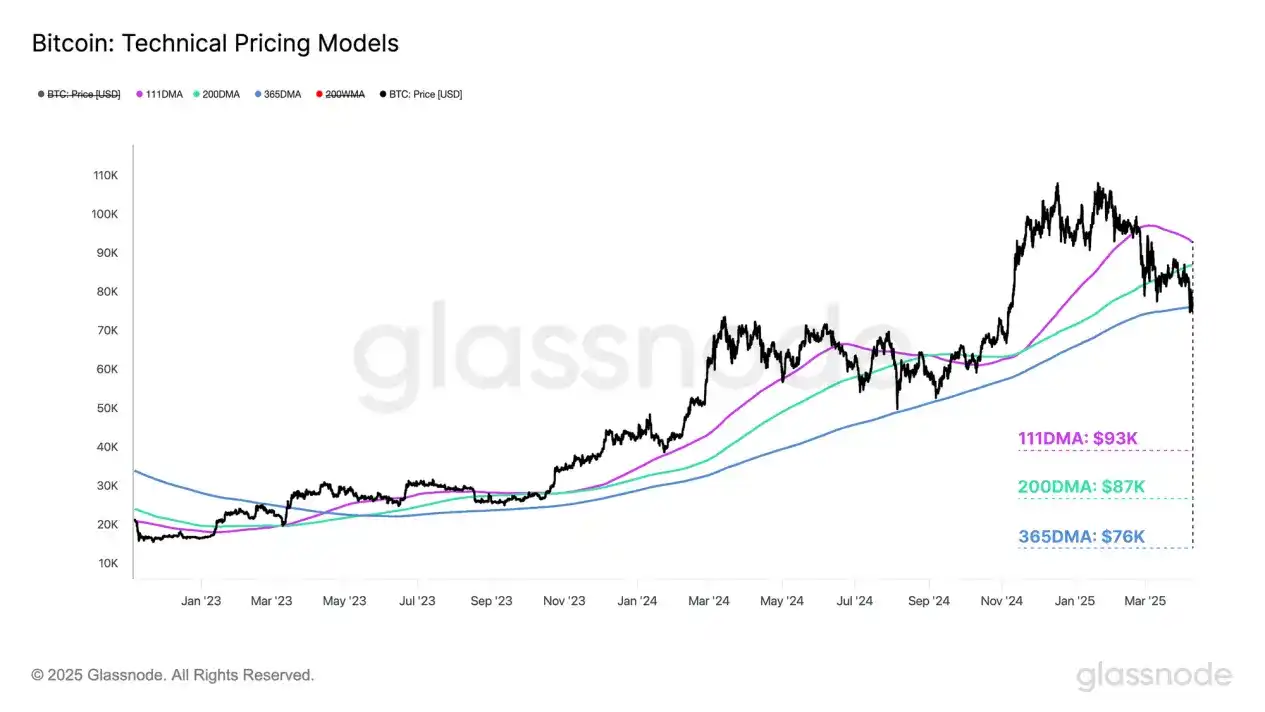
Technical analysis has long been an important tool for investors, and Bitcoin investors usually focus on a set of key moving averages. Among them, the 111-day, 200-day, and 365-day moving averages (111DMA, 200DMA, 365DMA) are common indicators used to measure Bitcoin market momentum.
You can refer to the following technical framework for analysis:
Bitcoin's initial drop below the 111-day moving average ($93,000) marked a significant blow to market momentum, and there has not been an effective rebound attempt since.
After the initial decline, the price oscillated around the 200-day moving average ($87,000), a level most technical analysts consider a bull/bear line. The market showed significant hesitation in this range, ultimately leading to another downturn and initiating a new round of price decline.
Recently, the price dropped below the 365-day moving average ($76,000) for the first time since the 2021 cycle. This key momentum support level has not yet been entirely breached. Failure to hold above it may trigger further downward momentum.
During the bull market uptrend, Short-Term Holders (STH) are typically the group that bears the brunt of market panic selling. Their behavior and emotional shifts serve as essential indicators for assessing market pullback intensity and investor responses.
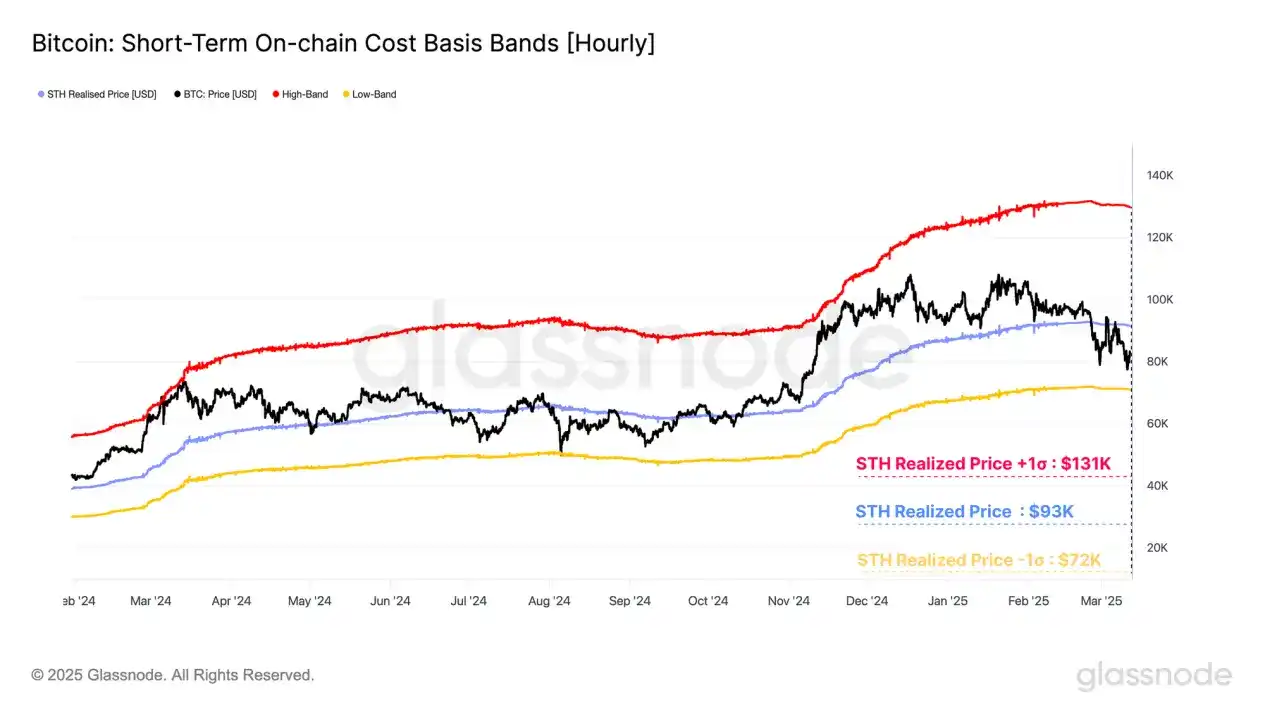
The Short-Term Holder (STH) cost basis has always been seen as a crucial reference level for judging market momentum during a bull market. Constructing a ±1 standard deviation range around this cost basis often serves as boundaries for local price fluctuations.
· Short-Term Holder Cost Basis +1σ: $131,000
· Short-Term Holder Cost Basis: $93,000
· Short-Term Holder Cost Basis -1σ: $72,000
Bitcoin's first break below the Short-Term Holder Cost Basis (STH-CB) signaled a weakening market momentum (also breaking below the 111-day moving average). The price later rebounded to below this cost basis and faced resistance, confirming a shift in investor sentiment.
Currently, the Bitcoin spot price has stabilized between the STH Cost Basis and one standard deviation below it, forming the upper and lower boundaries of the current trading range, namely $93,000 to $72,000.
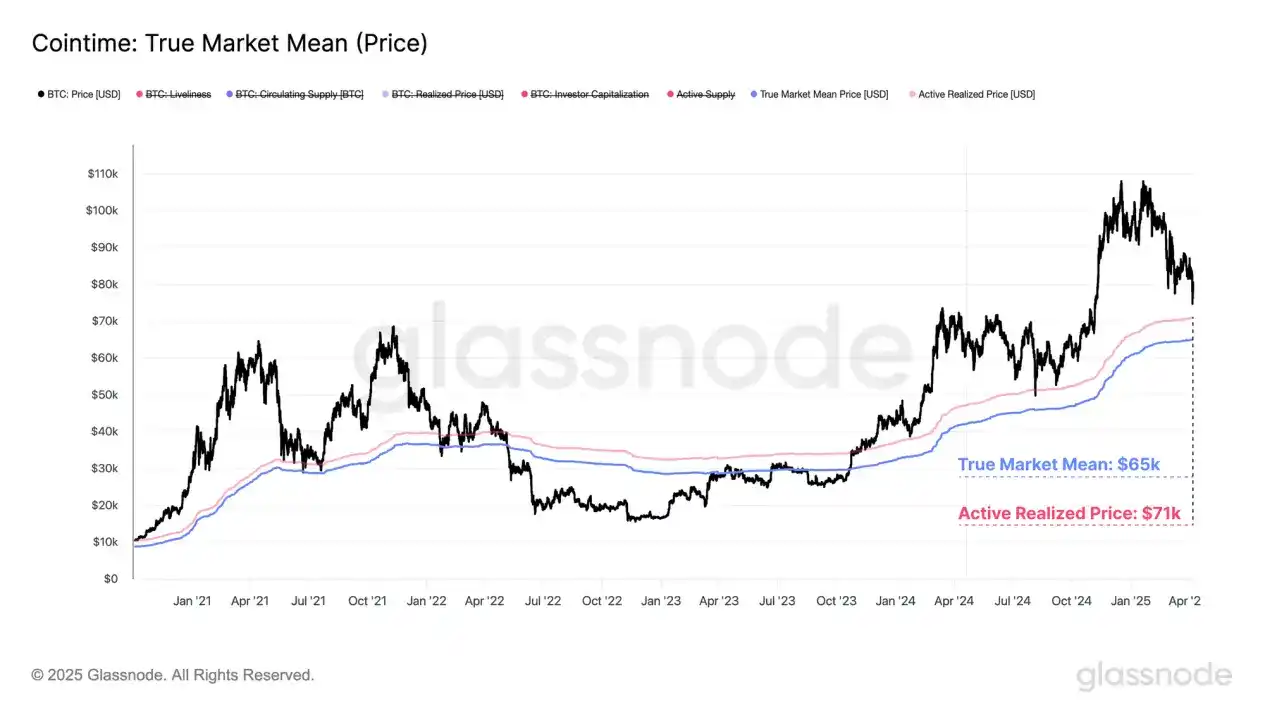
Active Realized Price and True Market Mean are another set of price models typically located near the midpoint of the Bitcoin cycle. These models estimate the cost basis of active participants in the market by excluding lost or long-dormant supply.
From a statistical perspective, on approximately 50% of trading days, the spot price fluctuates above or below these two models, making them essential mean reversion references used to delineate the market state boundaries between a bull and bear market.
· Active Realized Price: $71,000
· True Market Mean: $65,000
Consensus from multiple on-chain price models indicates that the $65,000 to $71,000 range is a key area where bulls are establishing long-term support. If the price were to convincingly break below this range, it would mean that a vast majority of active investors are sitting on unrealized losses, potentially significantly impacting overall market sentiment.
Conclusion
Amid escalating uncertainty around U.S. tariff policies, global financial markets are experiencing increasing pressure. This weakened stance has spread to nearly all asset classes, evident from significant pullbacks in major macro indices.
The digital asset market has not been immune, with all subsectors experiencing a broad-based contraction. Bitcoin's price briefly dipped to $75,000, marking one of the steepest pullbacks since the bull market began in January 2023. Ethereum saw even more significant losses, and many low-cap crypto assets are currently deep in a bearish trend.
Combining various on-chain and technical price model analyses, the $65,000 to $71,000 range is seen as a key area where bulls are rebuilding long-term support. If the Bitcoin price were to fall below this range, market sentiment could suffer a major blow as the vast majority of active investors would be holding positions at a loss.
Recommended
The Wall Street Journal: How is AI Trading Stealing the Limelight from Cryptocurrency?
Aug 15, 14:00
Tencent Still Has a Dream
Aug 15, 11:27
To Catch North Korean Hackers, They Set Up a Fake Project
Aug 15, 10:00
From Litigation to Settlement: Positive Signal Released by HTX's Negotiation with FCA
Aug 14, 19:32
11,742 Shipping Addresses Exposed Alongside Trezor Orders
Aug 14, 19:01
Founder Interview: FOMO Creator Explains How They Added 30,000 Users in One Day and Became One of the Fastest-Growing Crypto Apps
Aug 14, 18:37