First Quarter Capital Expenditure: $5.6574 billion, where did Nebius's expansion funding come from?

On August 12, AI cloud infrastructure company Nebius released its second-quarter performance as of June 30. According to the company's performance press release and shareholder letter, the group's quarterly revenue was $5.823 billion, while cash spent on purchasing property, plant, and equipment reached $5.6574 billion.
On one side is the newly recognized revenue, on the other side are GPUs and data centers being deployed ahead of revenue. In the same quarter, Nebius also disclosed four landmark AI cloud contracts, with an average total contract value exceeding $1 billion each. Putting these numbers together easily paints a smooth story - customers signing deals, company expanding capacity, and revenue continuing to climb.
However, the chain of contracts, cash, equipment, and revenue in this story is not moving at the same pace. The true dissecting point of Nebius's second quarter is how customer demand engaged in funding expansion and what has made its way into the financial statements versus what still resides in contract terms or management estimates.
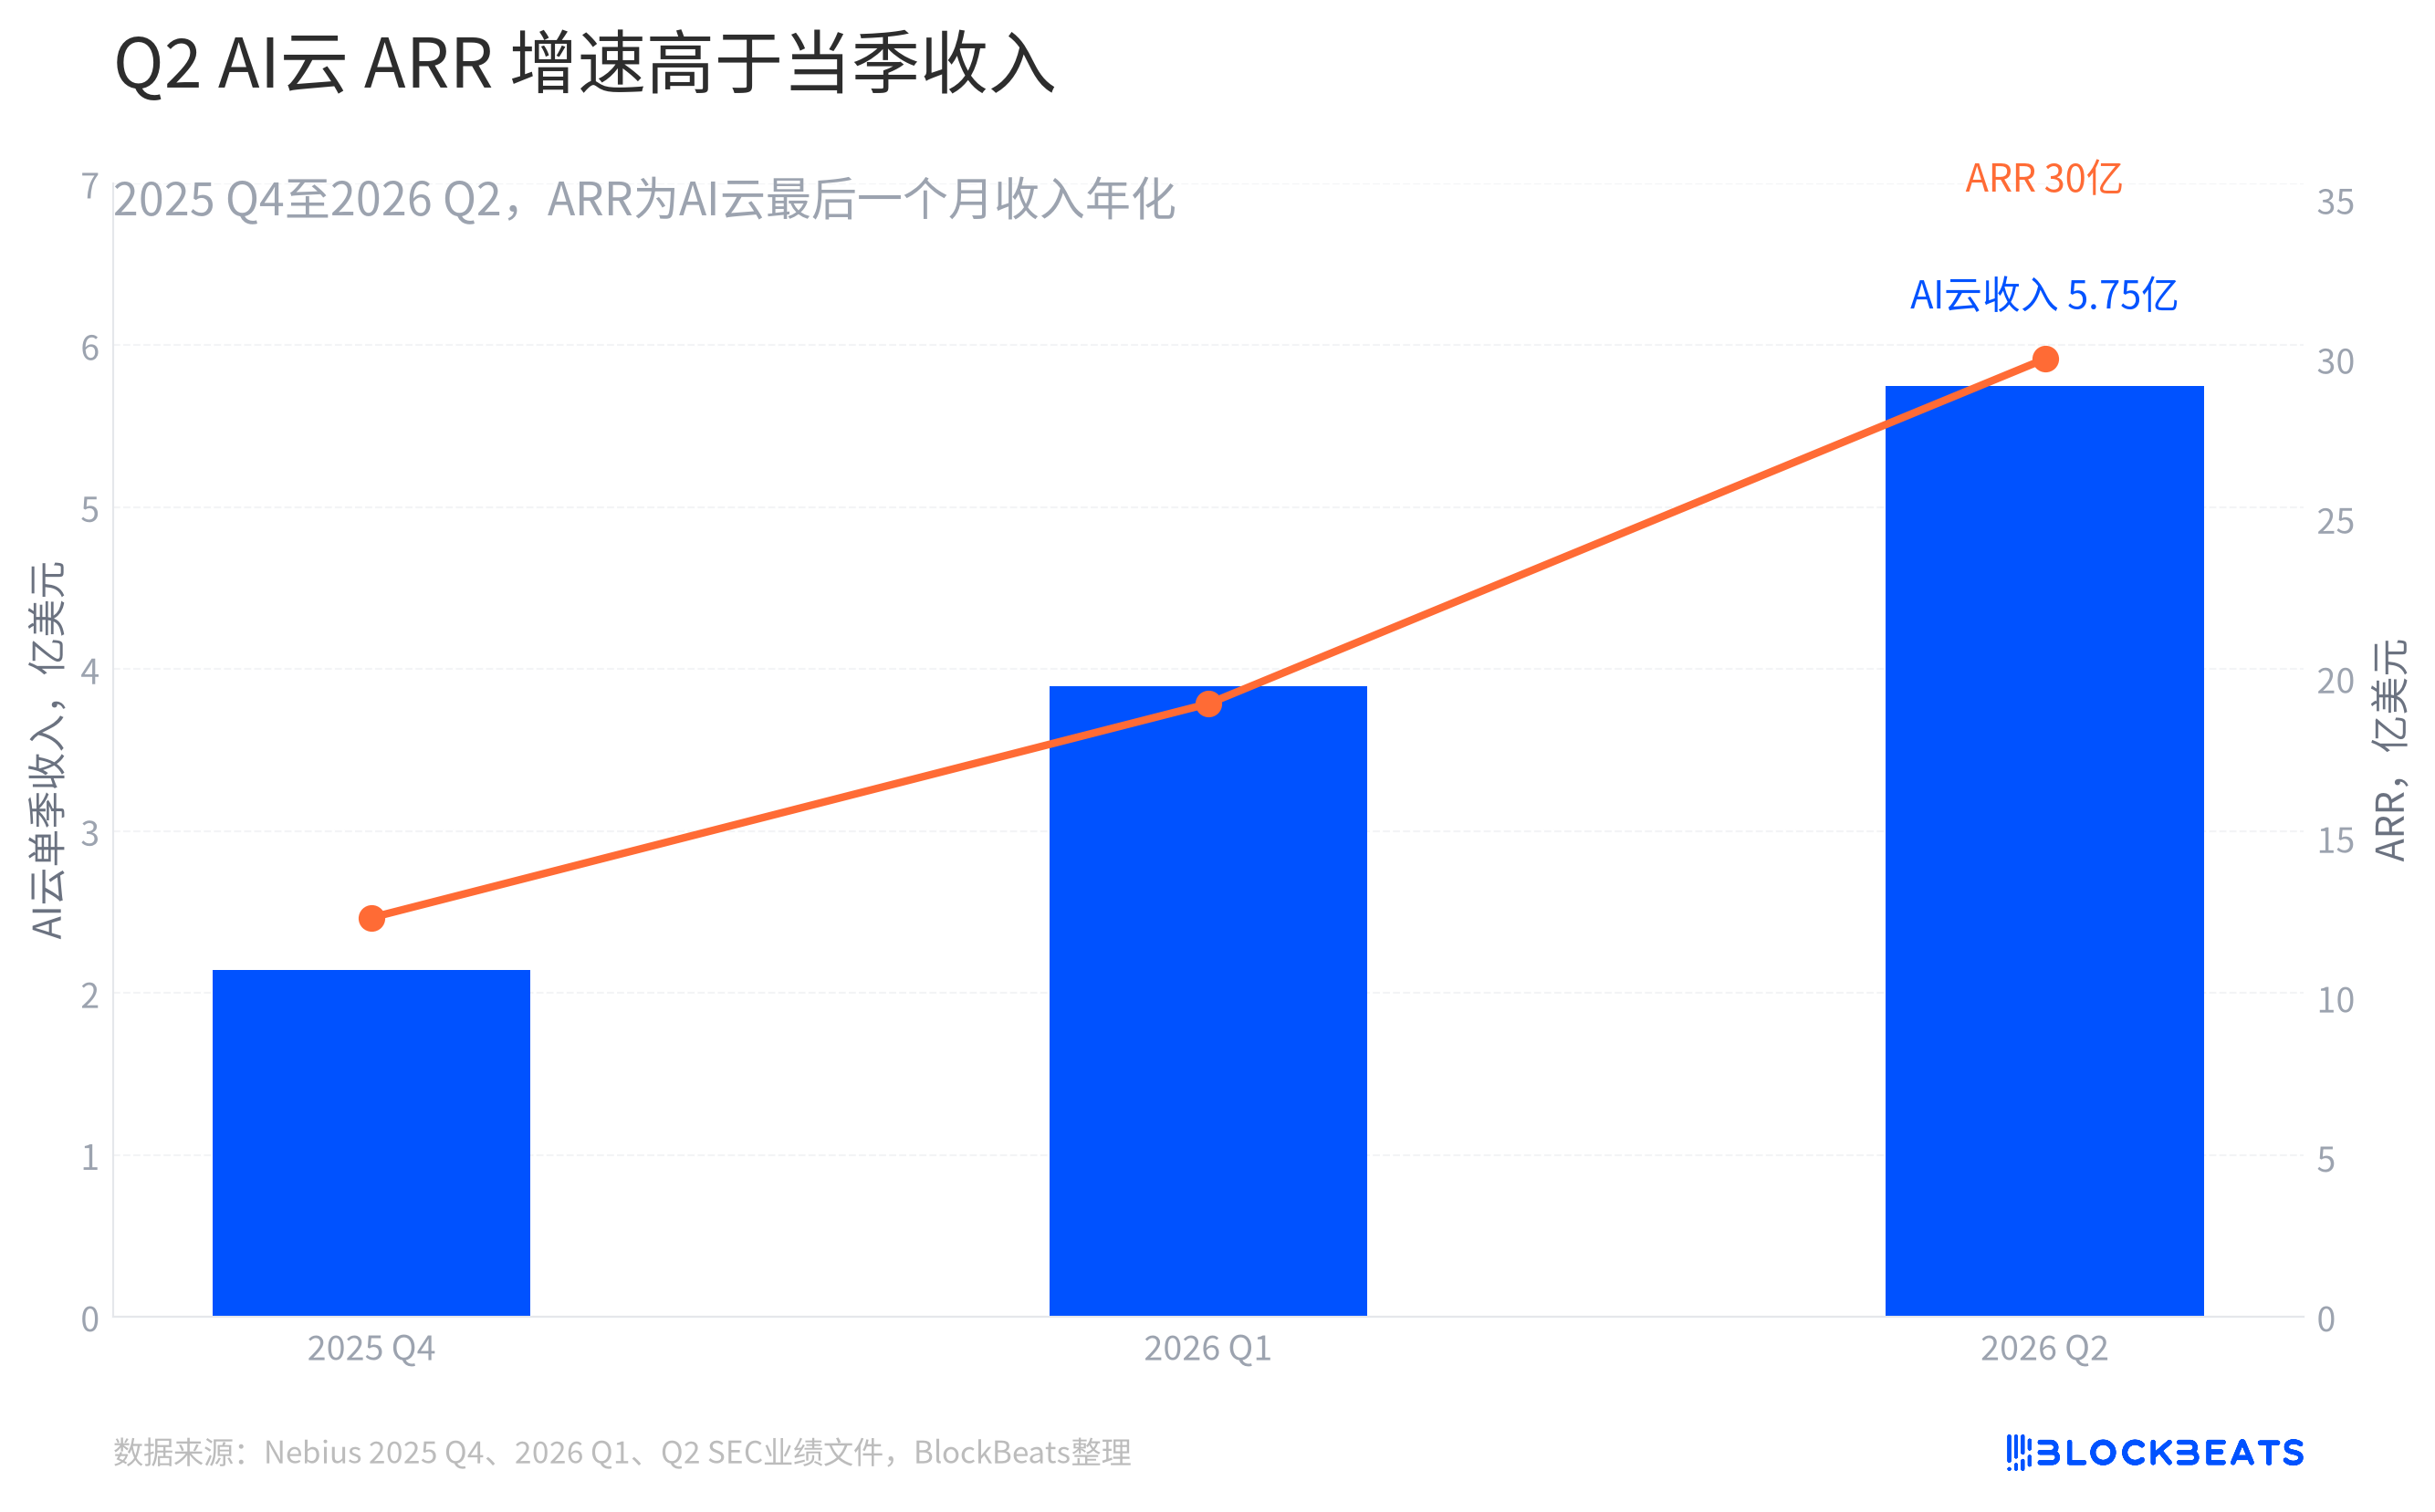
Let's first look at what has already happened. According to Nebius's Q2 2026 shareholder letter, the group's revenue has increased from $2.277 billion in Q4 2025 to $5.823 billion this quarter. In the second quarter, the AI cloud business contributed $5.749 billion, almost constituting the entire revenue.
The orange line on the chart represents the $30 billion AI cloud ARR. It is not revenue locked in for the next 12 months but an annualized run rate calculated by multiplying the AI cloud revenue in the last month of the quarter by 12. This metric is more like a speedometer showing the current pace of the business at the end of the quarter.
As per the editorial calculation, Q2 ARR grew by 56.3% from the previous quarter, slightly faster than the group's revenue growth of 45.9%. These two metrics are not entirely comparable. The former only looks at the last month of the AI cloud business, while the latter represents a quarter for the entire group. Placing them on the same chart allows us to observe the timing difference between demand momentum and recognized revenue, rather than treating ARR as order amounts.
The profit perspective needs a separate look. According to the company's performance press release, Q2 group non-GAAP adjusted EBITDA rose to $2.362 billion. Meanwhile, the GAAP net loss from continuing operations was $1.904 billion. The adjusted EBITDA excludes items such as depreciation, amortization, equity incentive, transaction-related costs, and interest. It can describe the adjusted operating performance but cannot be directly translated into cash profit already earned.
Revenue growth does not necessarily mean that the money for construction has already been covered by the revenue itself. For a company that continues to purchase GPUs, connect to power, and build data centers, this money is often spent before service delivery.
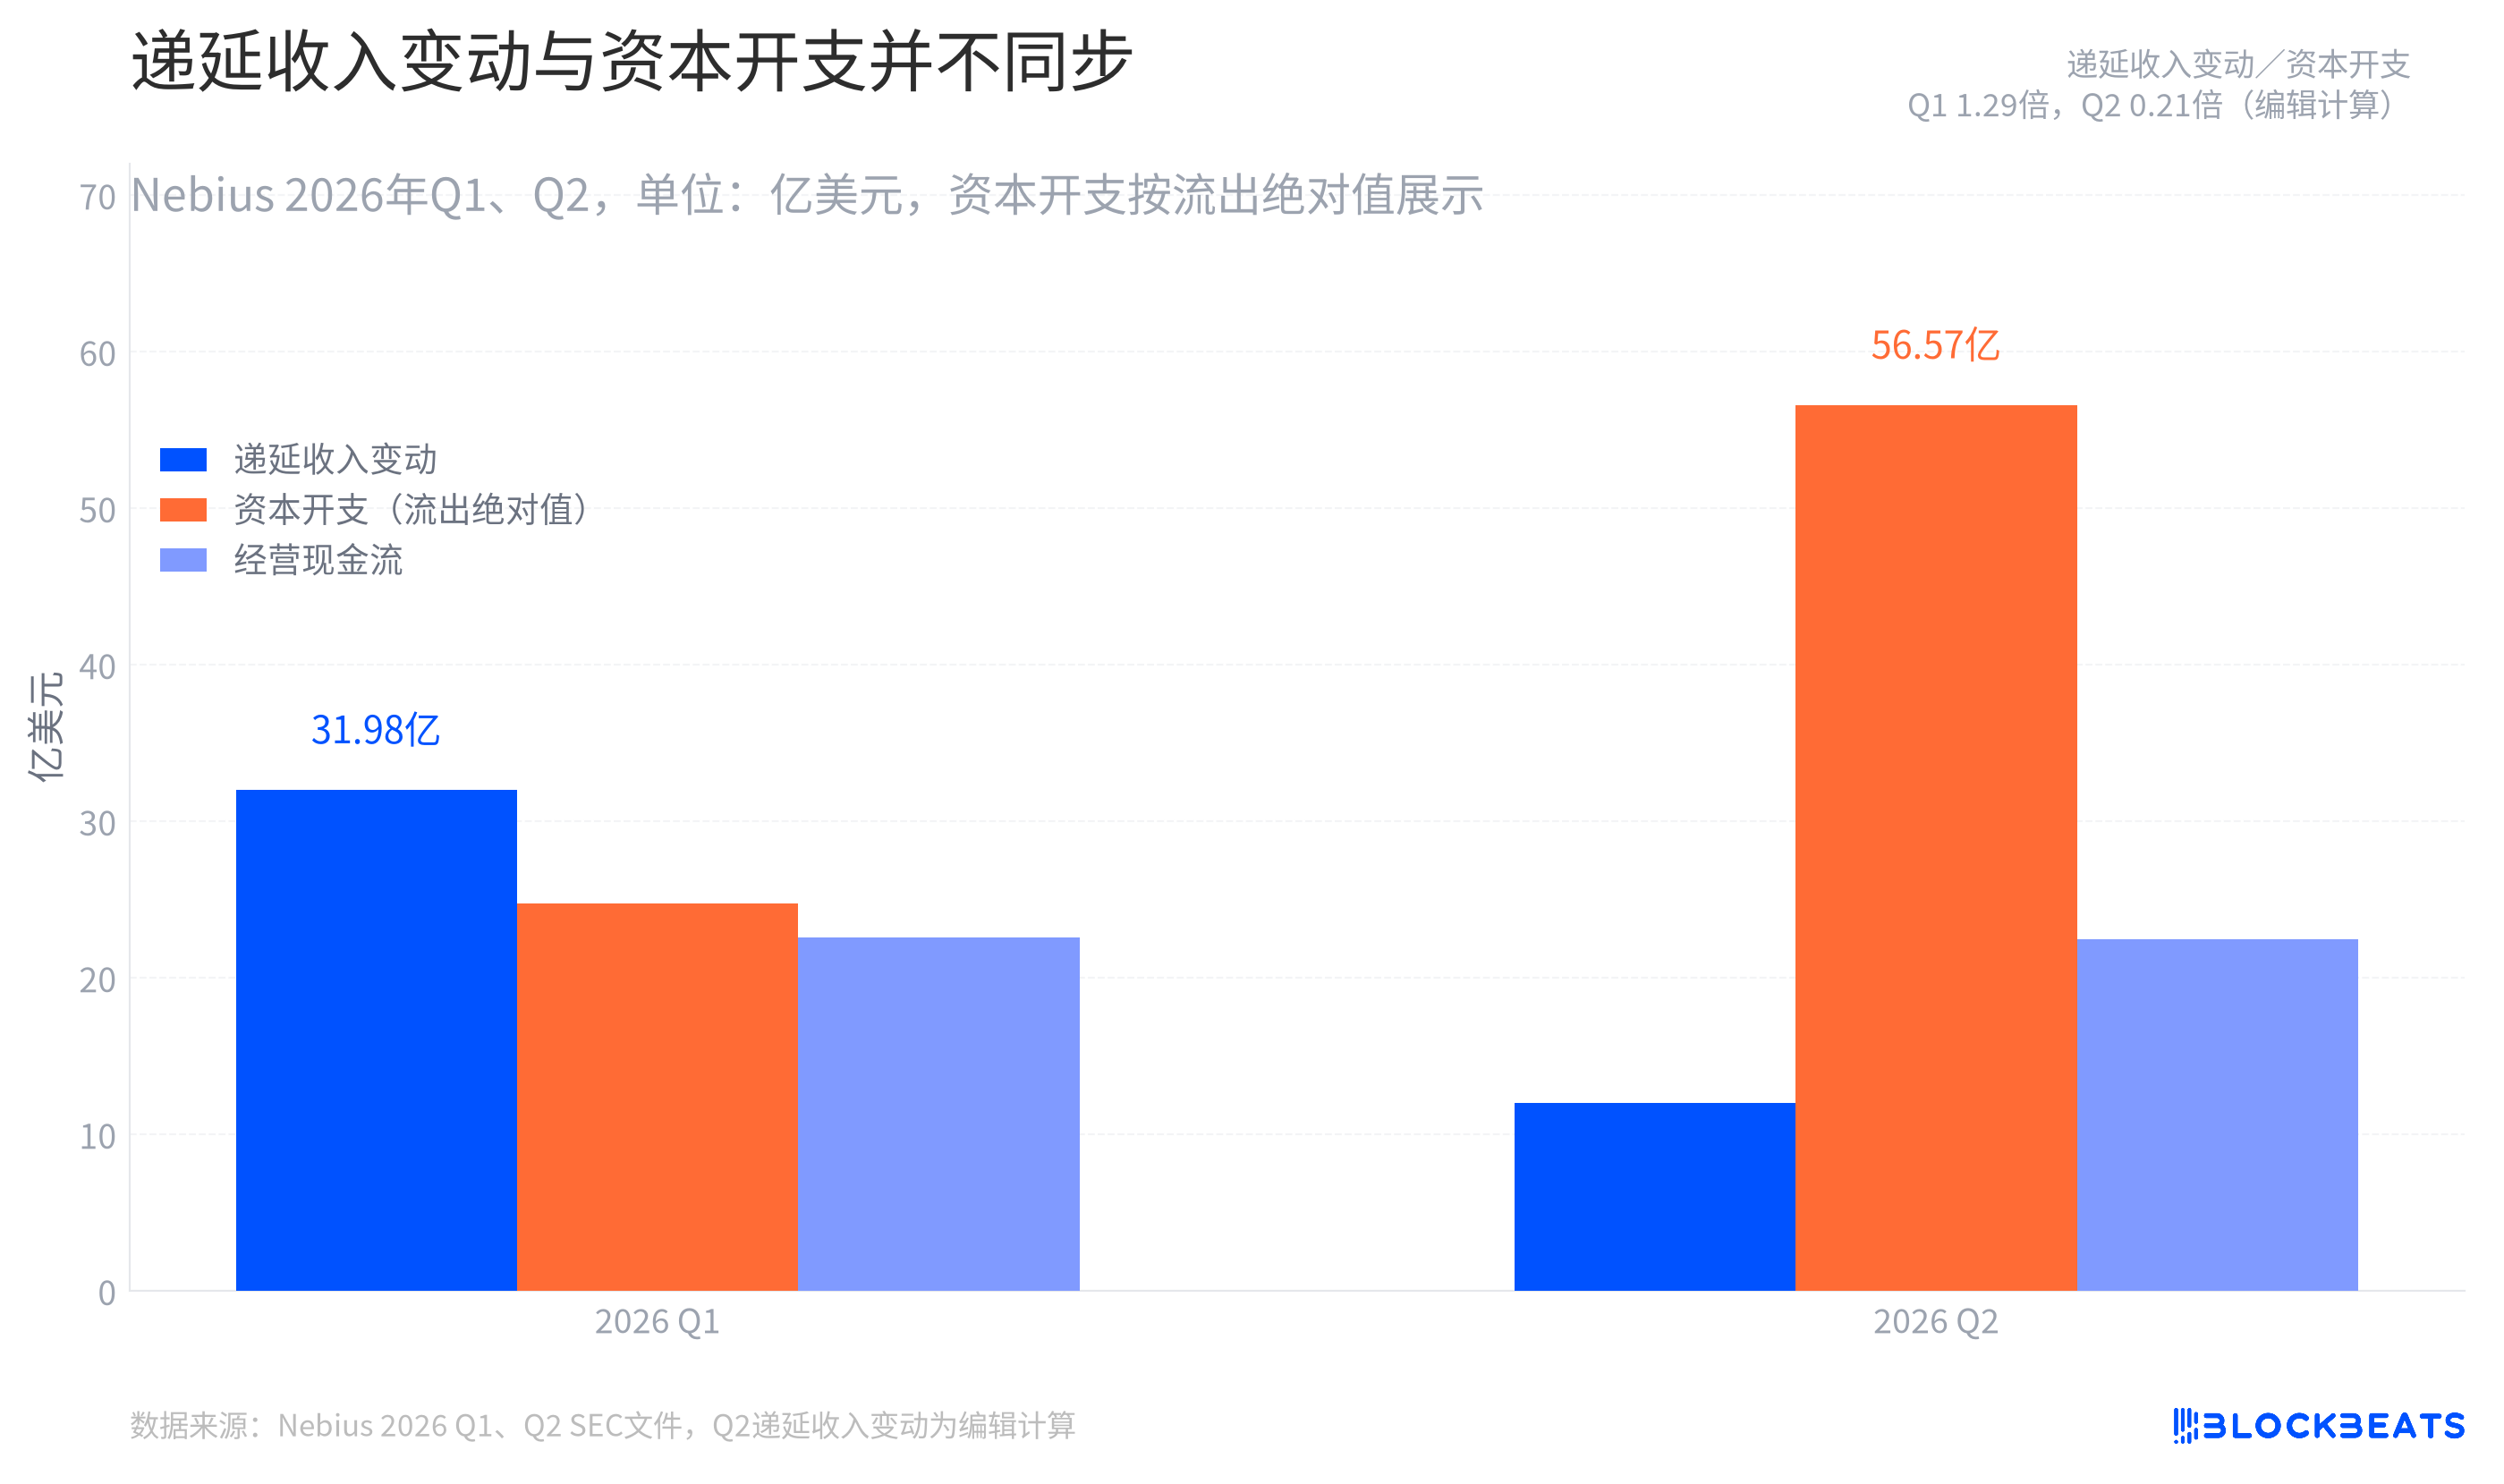
The second figure juxtaposes several easily confused numbers from the cash flow statement. In the first quarter of 2026, the change in deferred revenue exceeded capital expenditures. By the second quarter, capital expenditures suddenly surged, far surpassing the change in deferred revenue.
According to Nebius's unaudited consolidated financial statements for the second quarter, the change in deferred revenue for the first half of the year was $43.950 billion, and capital expenditures were $81.303 billion. The change in deferred revenue in the second quarter in the figure is calculated as the first-half disclosure minus the first-quarter disclosure. It is not second-quarter revenue and cannot be directly called all customer prepayments received in that quarter.
This distinction is crucial. The change in deferred revenue is an item in the cash flow statement that affects operating cash flow, while the year-end balance of deferred revenue is a stock on the balance sheet. Both are related to the pace of customer payments but cannot be added together and labeled as customer deposits for a particular quarter.
The operating cash flow in the second quarter remains positive, but capital expenditures, when calculated as an absolute cash outflow, are already about 9.7 times the revenue for that quarter. According to the company's financial report, this is more like first loading the power, racks, and servers of a computing power market and then waiting for customers to settle based on their usage rate. Customer cash can alter the timing of construction funds but cannot be used to infer that every equipment investment has already been covered by customer payments.
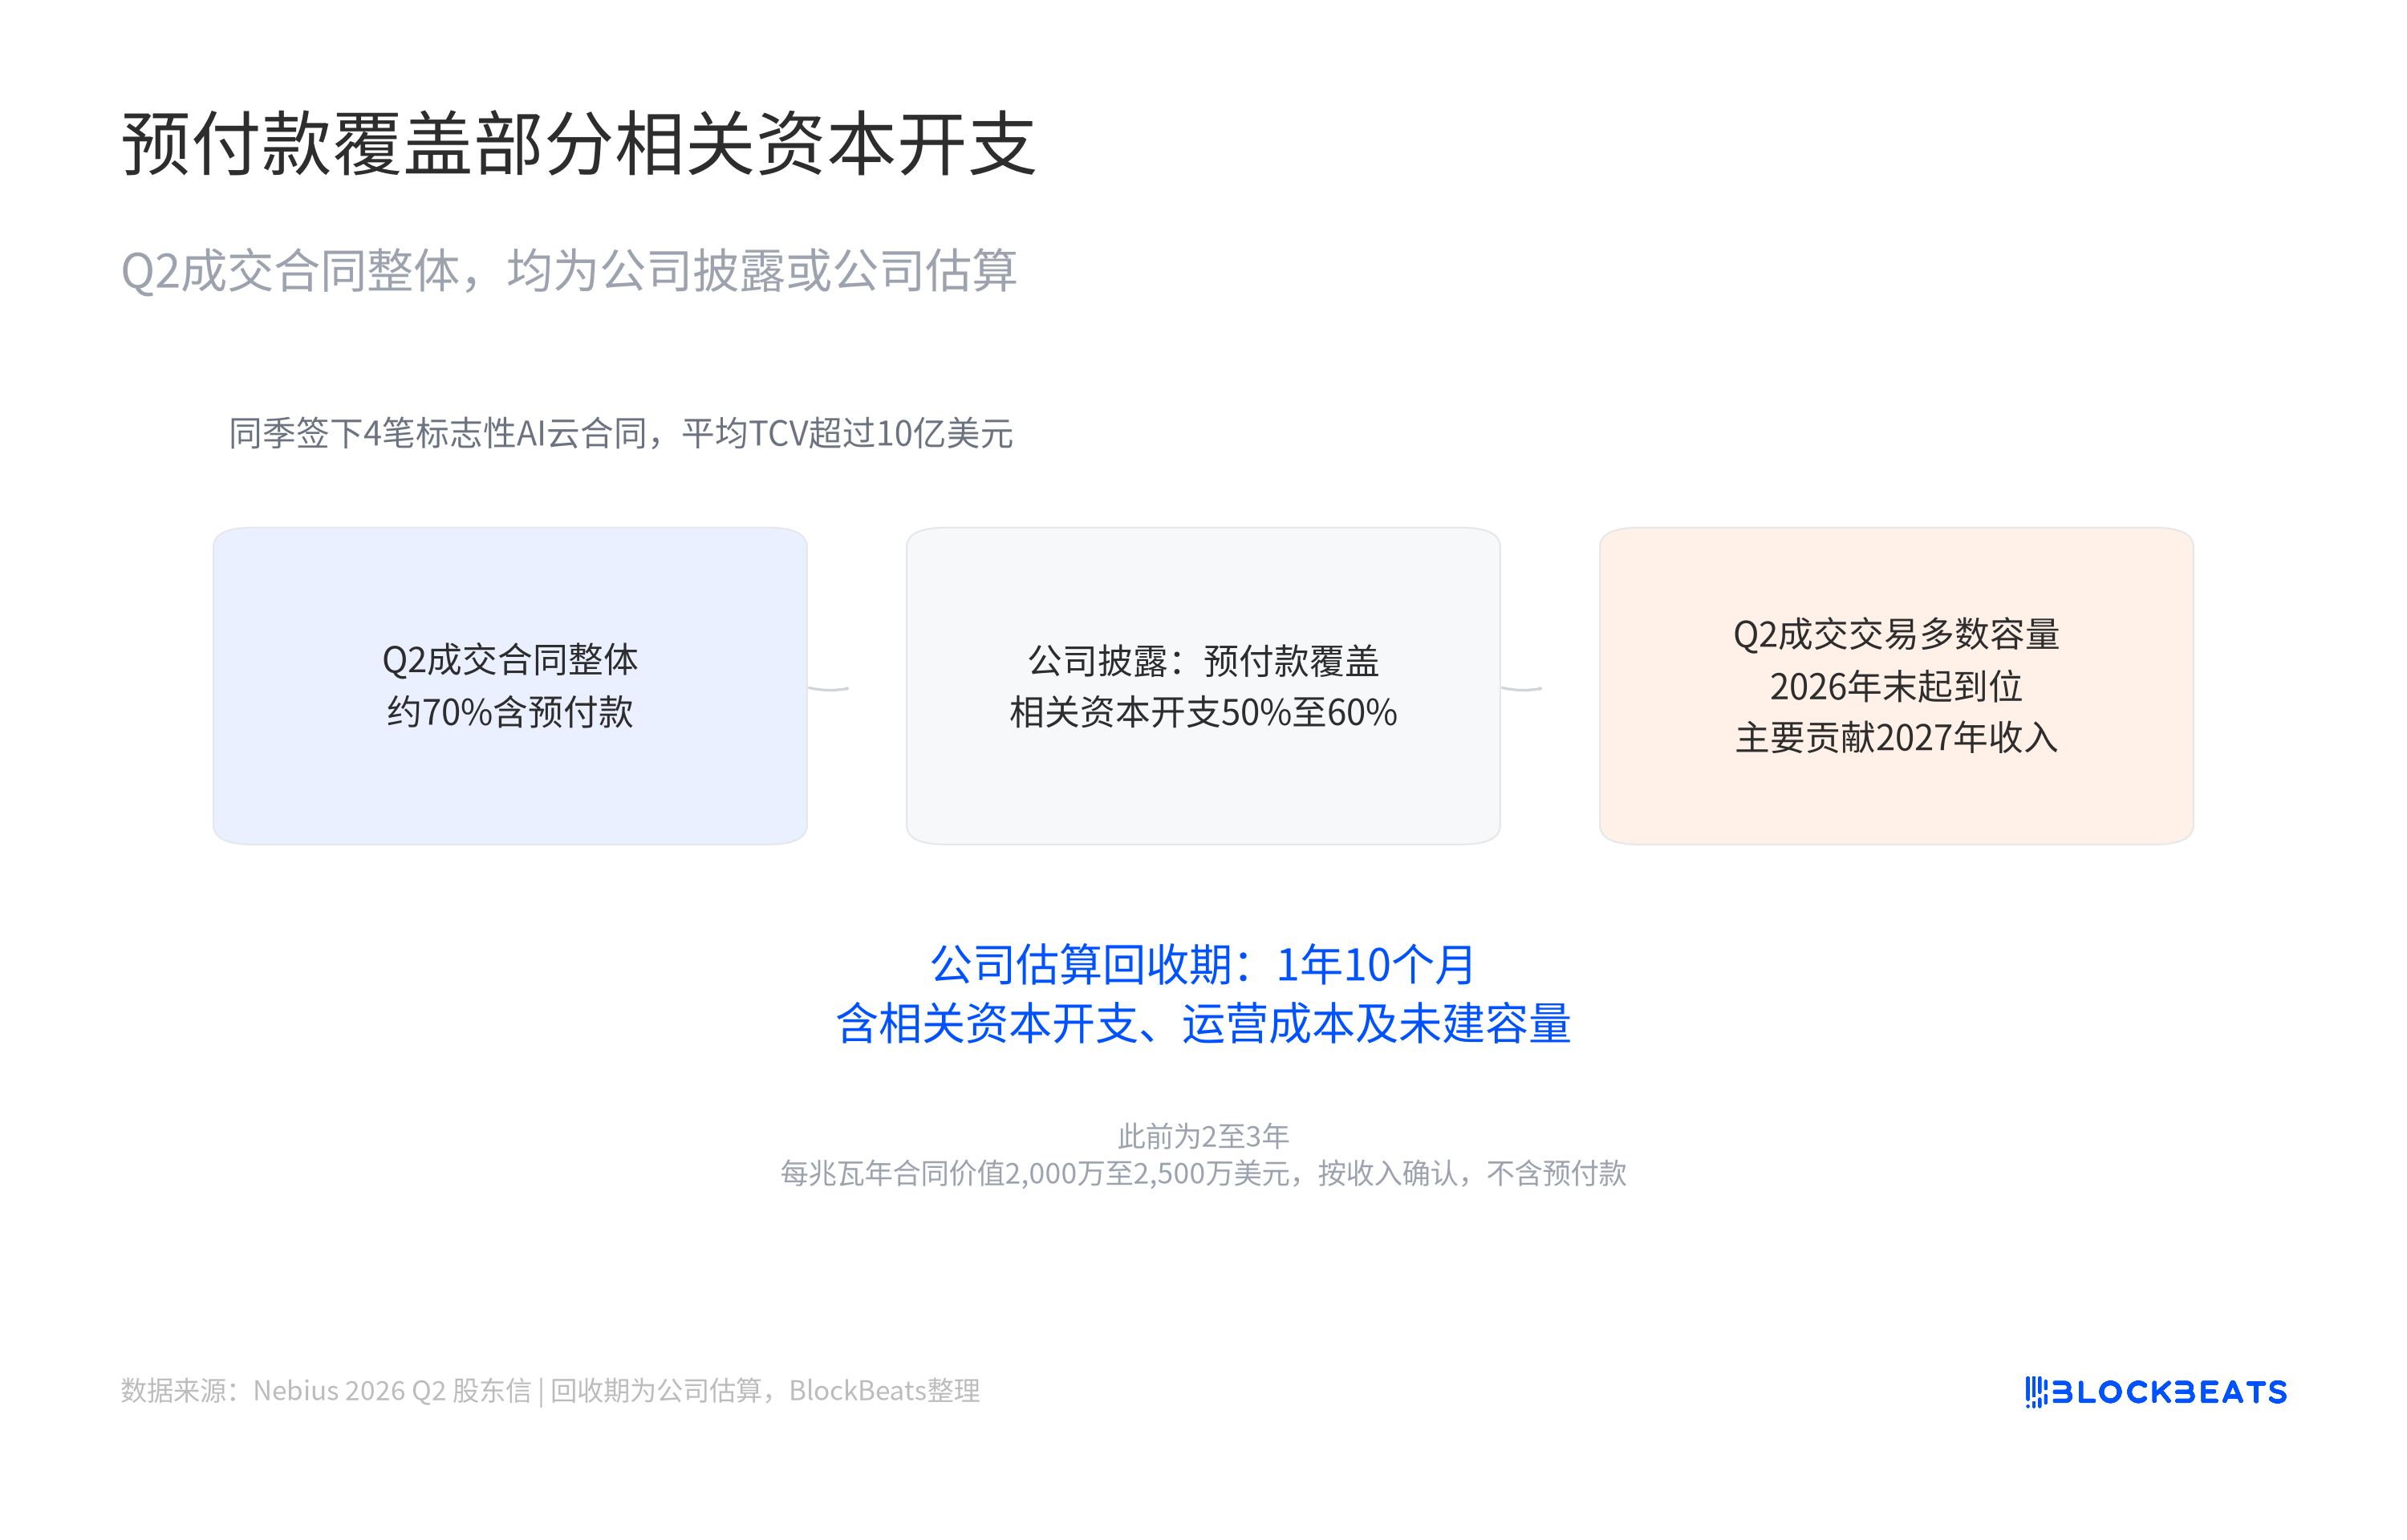
Nebius provides a closer look at the contractual economics in a shareholder letter. The company signed four landmark AI cloud contracts in the same quarter, with an average TCV, total contract value, exceeding $1 billion. This number describes the contract scale, not revenue already recognized by the company.
Another set of more broadly applicable but also more delicate data is disclosed. The company revealed that about 70% of all transactions closed in the second quarter included customer prepayments. These prepayments cover 50% to 60% of the related capital expenditures. This does not mean that every deal in the four landmark contracts aligns with this percentage, nor can it be extrapolated to suggest that all of Nebius's capital expenditures are covered by customer payments.
Nebius estimates that the capital expenditure and operating cost payback period for these new signed deals is 1 year and 10 months, with a historical range of 2 to 3 years. The key word here is "estimates." It relies on cost projections and signed future capacity, including parts that are yet to be constructed. The company disclosed that the contract value per megawatt-year is $20-25 million, based on revenue recognition criteria, excluding prepayments.
The majority of the second quarter trading volume will gradually come online by the end of 2026, contributing mainly to the 2027 revenue. Therefore, prepayments, capital expenditures, and revenue recognition have formed a somewhat uneven relay. Prepayments first alleviate some of the related expansion funds, equipment is deployed first, and revenue will enter the P&L statement only after the capacity is truly delivered.
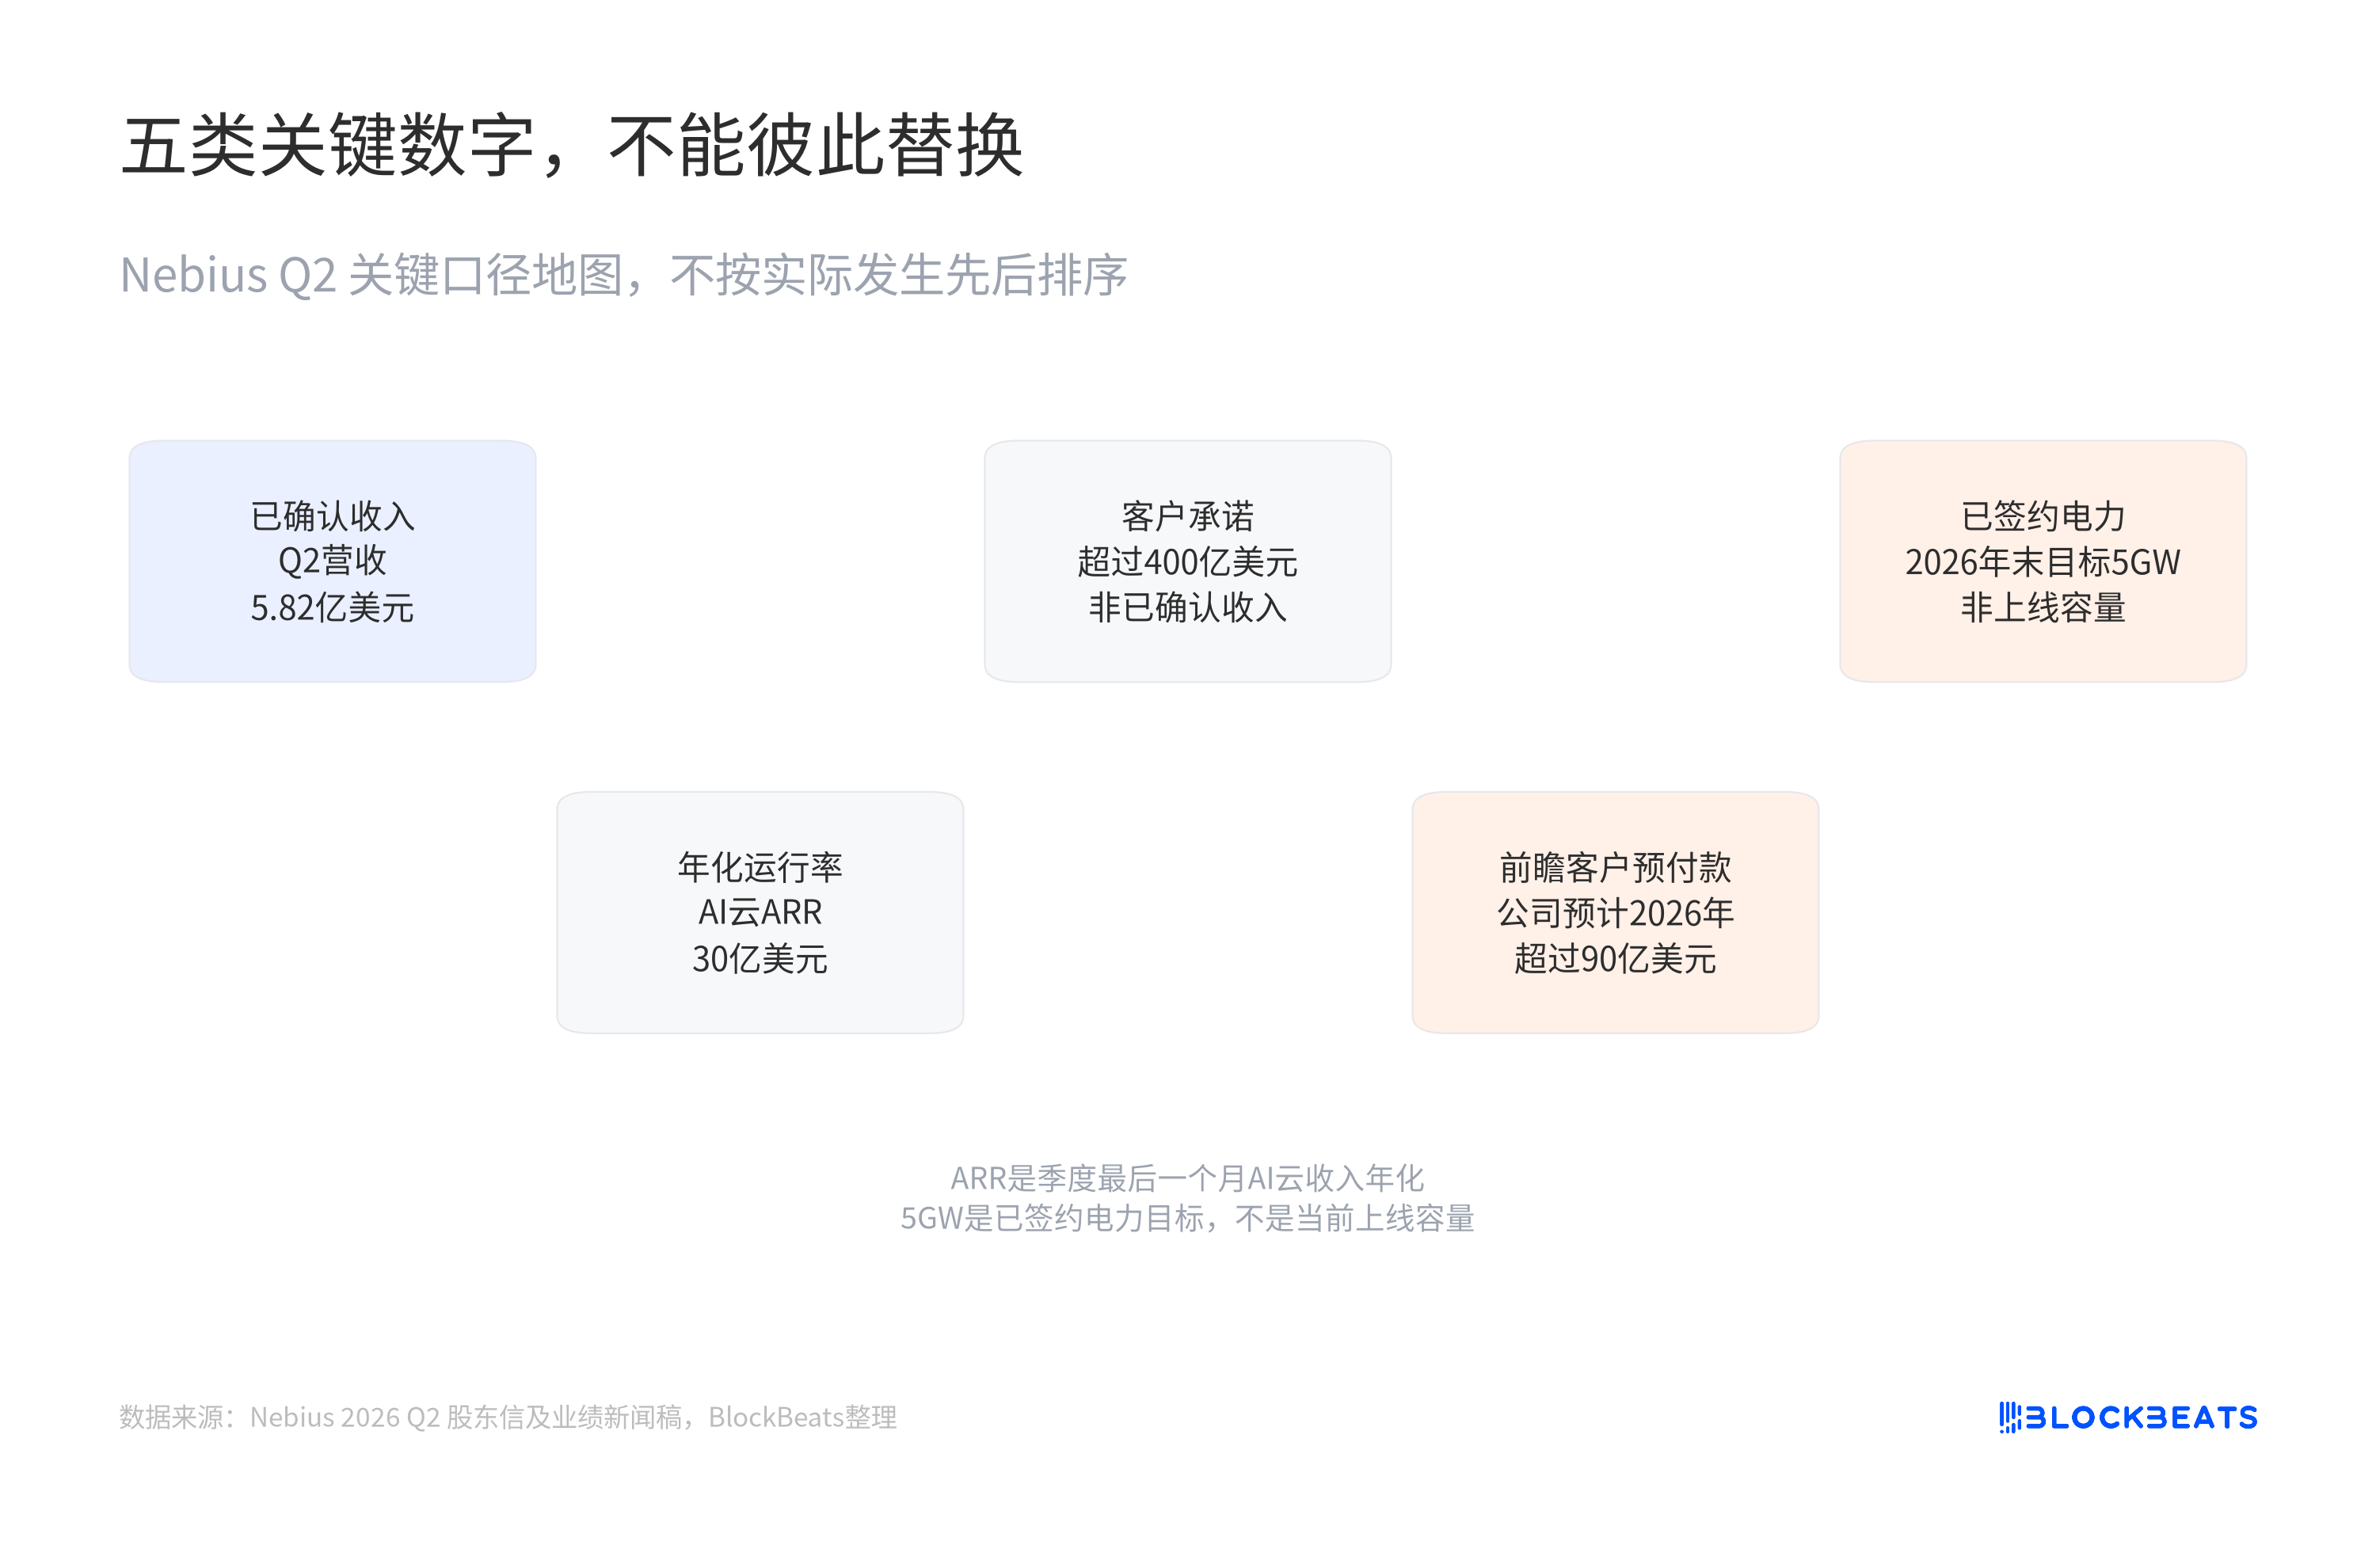
The fourth chart does not rank indicators by the amount but rather breaks down five indicators commonly lumped together in the same paragraph. The $5.823 billion is the quarter-end revenue already recognized as of the end of June. The $30 billion represents the annualized run rate of the AI cloud business at quarter-end, both describing business activities that have already occurred but within different observation windows.
The customer commitments exceeding $40 billion are contractual commitments disclosed by the company, reflecting the subsequent fulfillment and revenue pace. According to the company's shareholder letter, customer prepayments are expected to exceed $9 billion in 2026. This is a forward-looking expectation of the management, not cash already listed on the Q2 balance sheet.
Also noteworthy is the 5GW. Nebius refers to the contracted power target expected to be achieved by the end of 2026, supported by signed land and power commitments. This does not represent the current online GPU capacity and cannot be directly converted into the computing power deliverable to customers during the quarter.
In Nebius's second quarter, the last thing to do is to add up contracts, prepayments, equipment, and revenue to arrive at a larger growth figure. They are all entering the same expansion chain at different speeds.
Recommended
Why Did NeoCloud Experience the Largest Gain During This Round of Tech Stock Rebound in the U.S. Market?
Aug 13, 13:23
The valuation of RoboCop, known as the "First Stock of Humanoid Robots"
Aug 13, 12:28
Coherent's $2 Billion Quarter: Revenue, Profit Margin, and Capex
Aug 13, 11:42
IOSG Weekly Brief | The Rise of Hermes: An Advanced Journey of a Web3 Team #340
Aug 13, 10:55
Hash Rate Surges, Code Agent Recruits | Rewire News Daily
Aug 13, 09:52
DeepSeek V4 Pro Officially Launched
Aug 13, 00:12